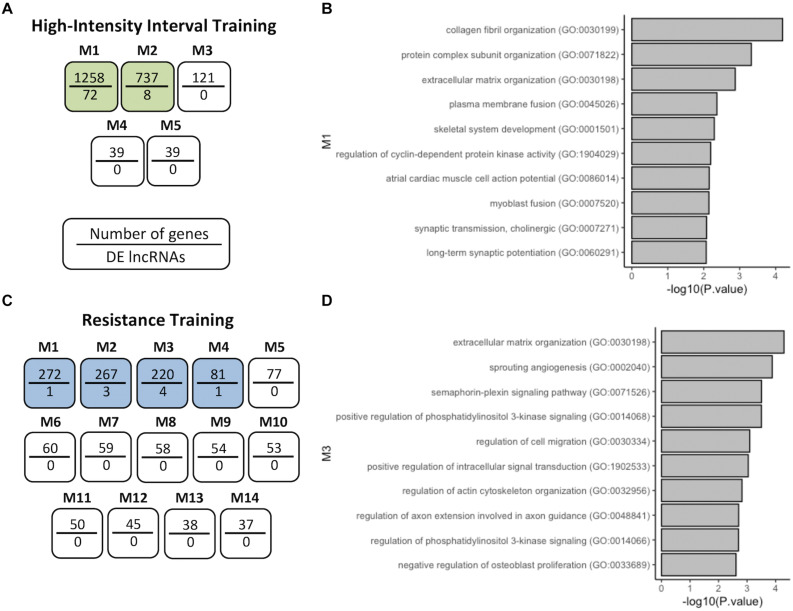
FIGURE 3.
Coexpression network analysis of genes in HIIT and RT. (A) HIIT modules after CEMiTool analysis showing that M1 and M2 coexpressed DELs. (B) GO terms of coexpressed protein-coding genes of M1-HIIT. (C) RT modules M1 to M4 coexpressed DELs. (D) GO terms of coexpressed protein-coding genes of M3-RT. The modules with at least one DEL are analyzed, shown here as modules with a higher number of DELs.

