Figure 3.

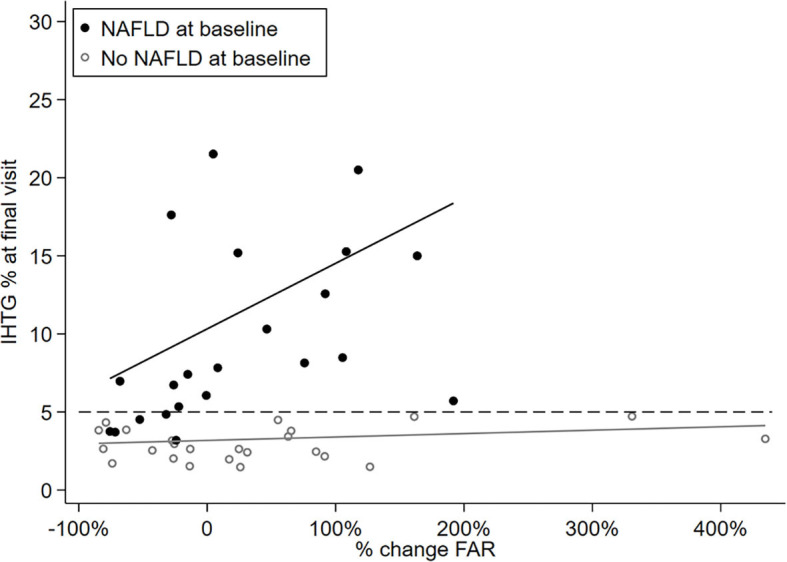
Scatterplot showing linear association between hepatic fat percent at final visit and percent change in the FAR by baseline NALFD status.

Scatterplot showing linear association between hepatic fat percent at final visit and percent change in the FAR by baseline NALFD status.