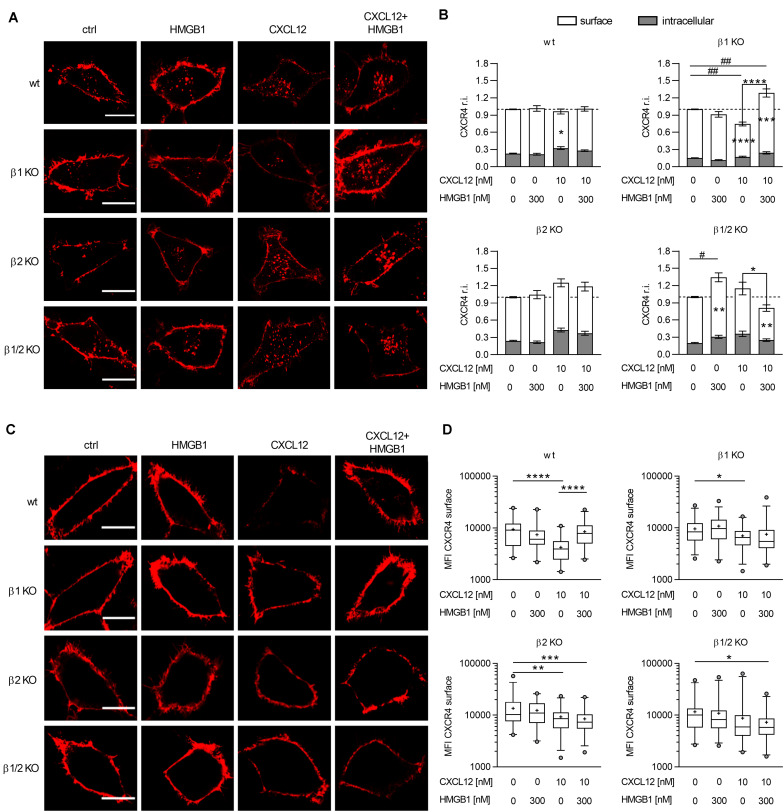
FIGURE 5.
The CXCL12/HMGB1 heterocomplex preserves CXCR4 on the cell membrane in a β-arrestin2 dependent manner. (A) CXCR4 trafficking in wt or β-arrestin KO HeLa cells, stimulated for 30 min with the indicated concentrations of CXCL12 and/or HMGB1: CXCR4-ACP (red). Representative images, of at least 3 independent experiments, are shown. Scale bar represents 6 μm. (B) Quantitative evaluation of CXCR4-ACP expression for each experimental condition. CXCR4 relative intensity (r.i.) on the cell surface or in the intracellular compartment was determined by dividing their specific CXCR4-ACP values for the total expression of the receptor in each cell. Data were then normalized to the relative expression of CXCR4 in stimulated cells over the matched unstimulated control. White bars represent surface CXCR4 expression, gray bars represent intracellular CXCR4 expression. Data are shown as mean ± SEM of at least 3 independent experiments analyzed with the ImageJ software. The following number of cells were analyzed (left to right): n = 70; 76; 77; 93 (wt); n = 56; 49; 59; 49 (β1 KO); n = 36; 38; 55; 65 (β2 KO); and n = 44; 45; 33; 33 (β1/2 KO). *p < 0.05, **p < 0.01, ***p < 0.001, and ****p < 0.0001: two-way ANOVA, followed by Tukey’s multiple comparison test was used to determine differences in surface or intracellular CXCR4 r.i. among groups. #p < 0.05, ##p < 0.01 one-way ANOVA, followed by Dunnett’s multiple comparison test was used to determine differences in total CXCR4 r.i. compared to unstimulated cells. (C) CXCR4 expression on the cell surface in wt or β-arrestin KO HeLa cells. HeLa cells overexpressing CXCR4-ACP were stimulated for 30 min with the indicated concentrations of CXCL12 and/or HMGB1 and then cultured for 1 h in fresh medium to allow CXCR4 recycling back to the cell surface: CXCR4-ACP (red). Representative images, of at least 3 independent experiments, are shown. Scale bar represents 6 μm. (D) Quantitative evaluation of CXCR4-ACP mean fluorescence intensity for each experimental condition. Data are shown as box and whiskers (2.5–97.5 percentile; “+” mean) of at least 3 independent experiments analyzed with the ImageJ software. The following number (n) of cells were analyzed: n = 45; 42; 52 (wt); n = 69; 64; 59; 73 (β1 KO); n = 62; 58; 67; 65 (β2 KO); and n = 53; 66; 62; 72 (β1/2 KO). *p < 0.05, **p < 0.01, ***p < 0.001, and ****p < 0.0001 using one-way ANOVA, followed by Tukey’s multiple comparison test.

