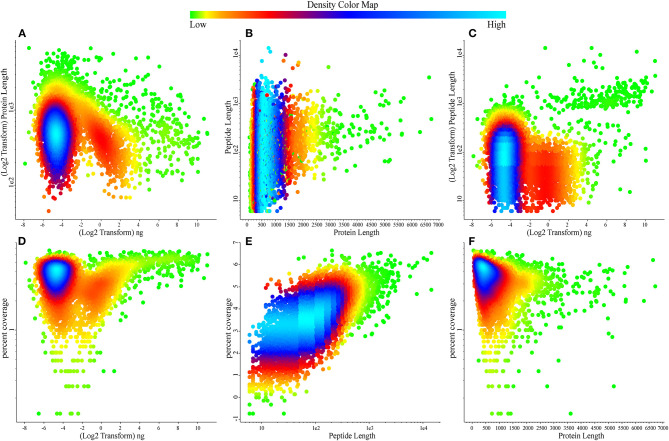
Figure 2.
Scatter relationship plots describing the density of attributes over the bovine whey proteome data. (A) Protein lengths over quantification values. (B) Peptide length over protein length. (C) Peptide length over quantification values. (D) Protein percentage coverage over quantification values. (E) Protein percentage coverage over peptide length. (F) Protein percentage coverage over protein length. Color map reports the density of the values in the data, green reports the low, dense data points while sky blue reports highly dense data points.

