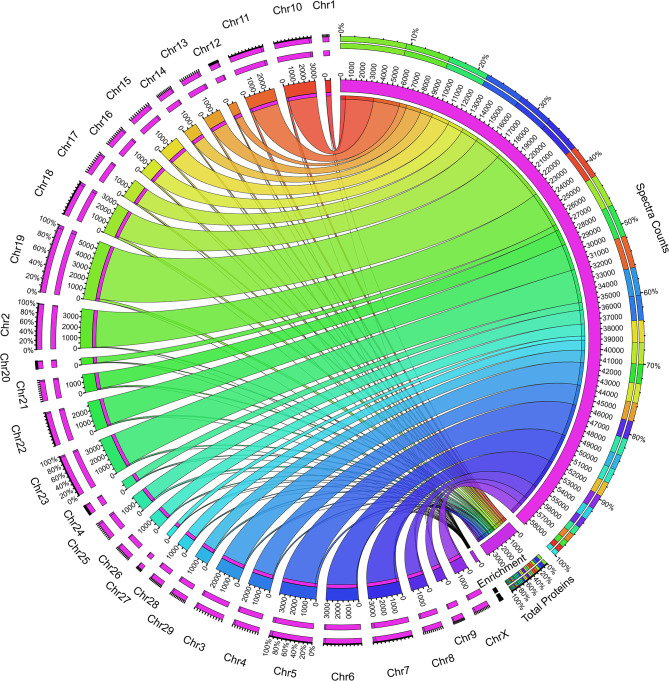
Figure 3.
Circos plot showing the whey protein expression mapped to individual chromosomes in the bovine genome. The right inner pink ring indicates the total spectra collected during the proteome analysis. The connecting set of ribbons describes the collection of spectra identified from individual chromosomes, and its width showed the number of spectra assigned. The higher the number spectra, the broader the ribbon width and vice versa. The bottom of the plot describes the total proteins assigned and the enrichment value based on the protein coded for the respective chromosome. The left outer ring describes the chromosomes and the number of protein assignment, which expresses bovine whey.

