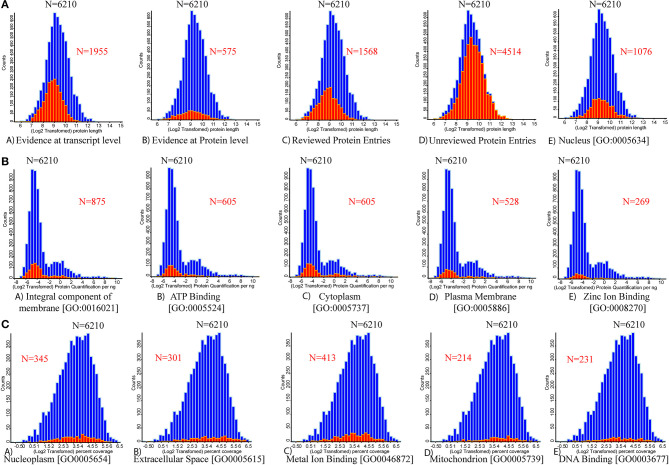
Figure 4.
Histograms for the distributions of the protein lengths, protein quantification, and percentage coverage are presented. The vertical axis of the histogram presents the number of each categorical protein in each bin. (A) Distribution of varying protein length (full length) counts identified through database mapping to the number of proteins. (A) Evidenced at transcript level. (B) Evidenced at protein level. (C) Reviewed UniProt database protein entries. (D) Un-reviewed UniProt database protein entries. (E) Protein associated with nucleus origin. (B) Mapping the number of protein quantification values for five high abundant UniProt-based GO terms. (A) Integral component of membrane. (B) ATP binding. (C) Cytoplasm. (D) Plasma membrane. (E) Zinc ion binding proteins. (C) Mapping the number of individual protein percentage coverage for the next five high abundant UniProt-based GO terms. (A) Nucleoplasm. (B) Extracellular space. (C) Metal ion binding. (D) Mitochondrion. (E) DNA binding. Red color overlapped histogram presents the respective mapped attribute over the whole bovine whey proteome data (n = 6,210).

