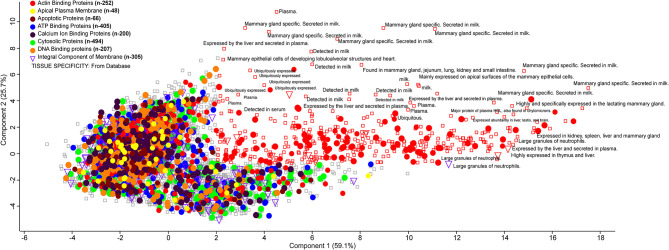
Figure 5.
PCA plot describing the orthogonal dispersion of the proteins reported in the deep whey proteome analysis. Color coding indicates the different class of major proteins identified in the whey proteome data. All the proteins identified to specific tissue from the UniProt database are reported with a rectangle.

