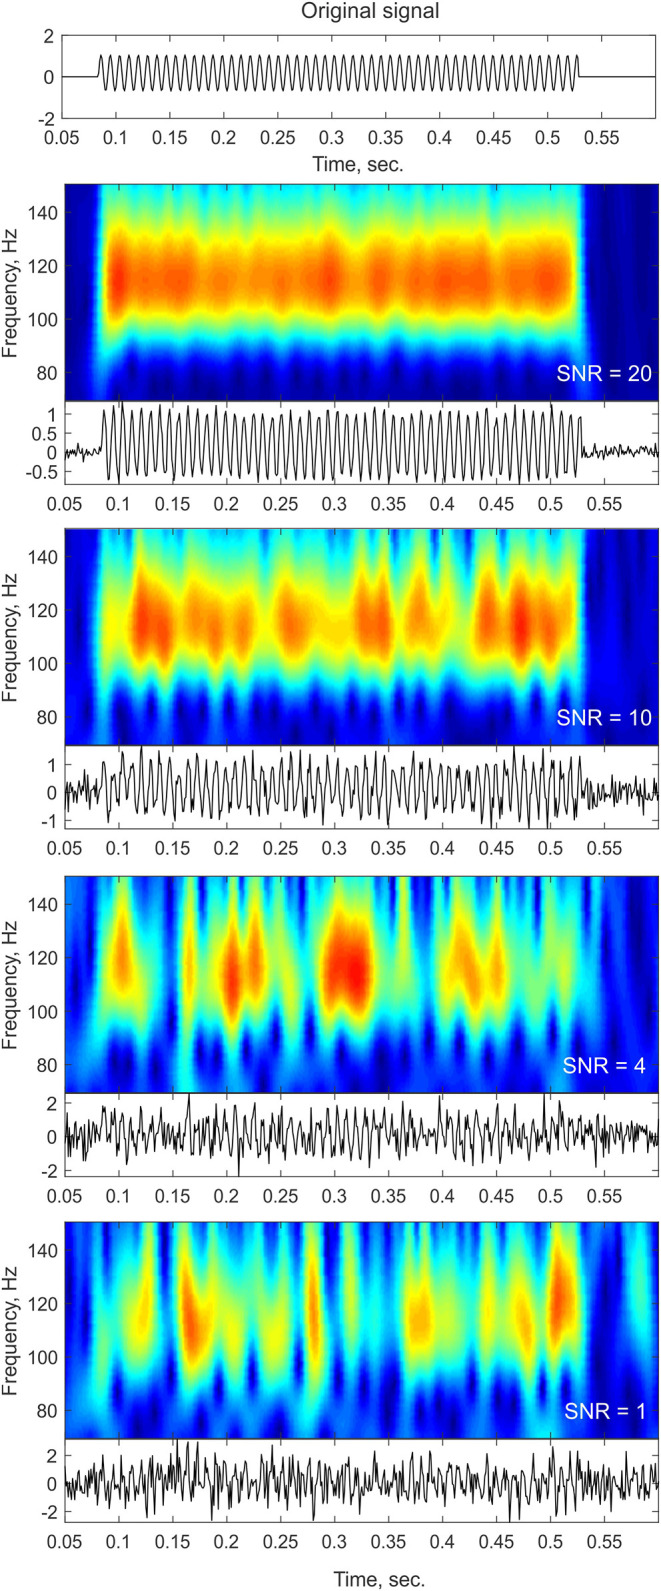
Figure 1.

Noise influence on time-frequency profiles. The top panel shows a trace of a pure sinusoid at 110 Hz with a constant amplitude lasting for a duration of ~400 ms. The bottom panels show the time-frequency representation of the signal (top insets) and the time-domain trace (bottom insets) after adding different levels of white Gaussian noise. As the noise level increases (lower SNR), the time-frequency profile contains more gaps and becomes more “bursty” in appearance. In cases of low SNR, such as the ones that might be observed in single trial or ongoing data, sustained oscillations might be broken down into isolated peaks and thus might be considered as transient bursts that might even slightly vary in frequency as a result of the noise structure.
