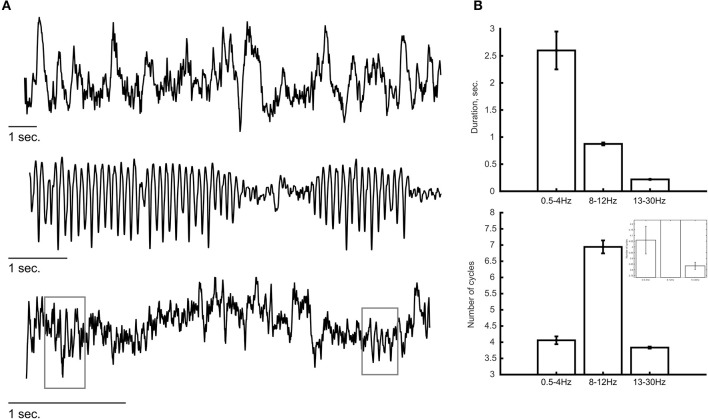
Figure 2.
Examples of ongoing oscillatory activity. (A) Top and middle panels show a trace of invasive recordings from sEEG electrodes showing low-frequency oscillations (0.5–4 Hz, top; 8–12 Hz, middle). (Bottom) Laminar probe recording from a non-human primate showing bursts of oscillatory activity at a frequency of 13–30 Hz. Gray rectangles indicate the detection of transient oscillatory bursts. (B) Descriptive analysis of the duration of oscillatory activity at each frequency band. The duration of oscillations (top) was estimated as the period of time in which the power at that frequency band exceeded the 95th percentile of the theoretical χ2 distribution of wavelet power values. The number of cycles (bottom) were calculated by multiplying the duration (in seconds) by the peak frequency of the oscillation (in Hz). Lower frequency oscillations (i.e., 0.5–4 and 8–12 Hz) tend to show longer durations compared with the higher frequency oscillations (13–30 Hz) in which most oscillatory bursts consisted of ~3.5 cycles. The inset shows a zoomed version to visualize the differences between 0.5–4 and 13–30 Hz. Error bars indicate standard error of the mean.

