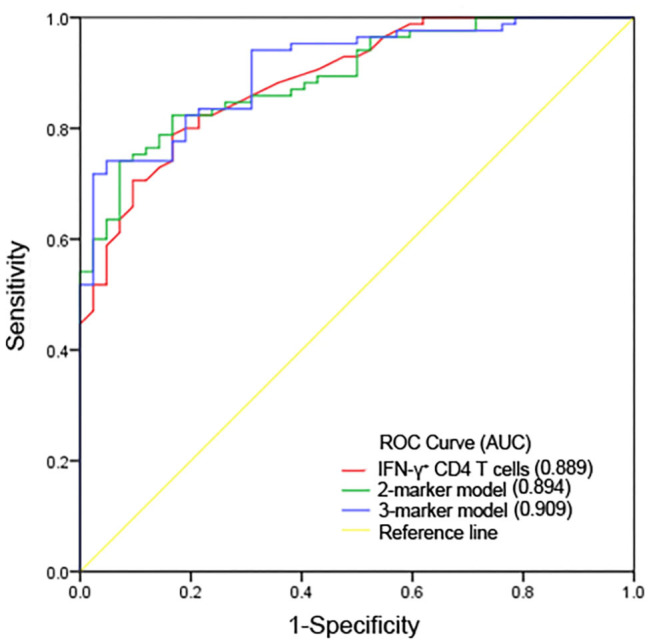
Figure 3.

ROC curves for predicting ability for 30-day mortality of IFN-γ+ CD4+ T cell numbers and predictive models. AUC, area under the curve.

ROC curves for predicting ability for 30-day mortality of IFN-γ+ CD4+ T cell numbers and predictive models. AUC, area under the curve.