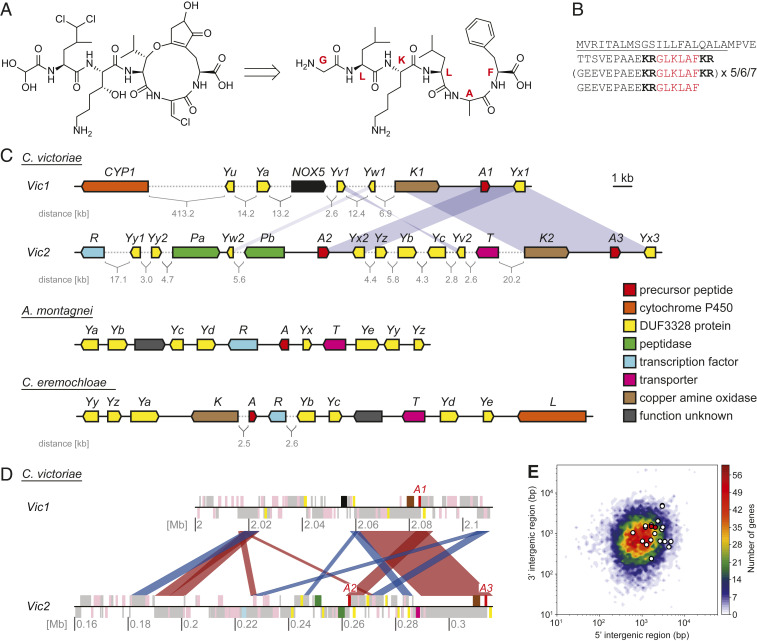
Fig. 2.
Analysis of victorin structure, biosynthesis, and genetic background. (A) Deduction of the unmodified peptide backbone sequence of victorin C from its structure. Red letters indicate the individual amino acids that make up the peptide repeat. (B) Precursor peptide amino acid sequence. The number of sequence repeats varies among the three gene copies (Note: not all repeats encoded in vicA3 are in frame, thus, the predicted numbers of core peptides in VicA3 vary with different intron–exon structure predictions). The signal peptide is underlined, the kexin protease recognition sites are shown in bold, and the core peptide is shown in red. (C) Putative victorin biosynthesis genes (Top) and putative biosynthetic gene clusters of vicA homologs in Apiospora montagnei and Colletotrichum eremochloae. Blue shade represents duplication of the highlighted gene or region. Numbers following a gene name indicate duplicates. Gene name identity between species does not necessarily imply homology (SI Appendix, Table S2). (D) Schematic of the genomic regions harboring the victorin precursor peptide genes (annotated here as A1–A3). Each chromosome is shown as a black line with the position in megabases (Mb) indicated. Gray blocks show locations where transposable elements have been annotated, and pink blocks show annotated FI3 genes. Blocks appearing above the chromosome line are encoded in the forward direction, and blocks below the line in the reverse. Other colors indicate the locations of genes with putative victorin biosynthetic genes with the same color code as in C. The red and blue ribbons connecting the two contigs show regions >2 kb with >80% identity between the two chromosomes. Red ribbons indicate alignments in the same direction, and blue ribbons indicate inversions. (E) Gene density heat map of the C. victoriae genome. Genes were binned based on the lengths of their 5′ and 3′ intergenic regions. Putative victorin biosynthesis genes are overlaid as white dots, and precursor peptide genes are overlaid as red dots.

