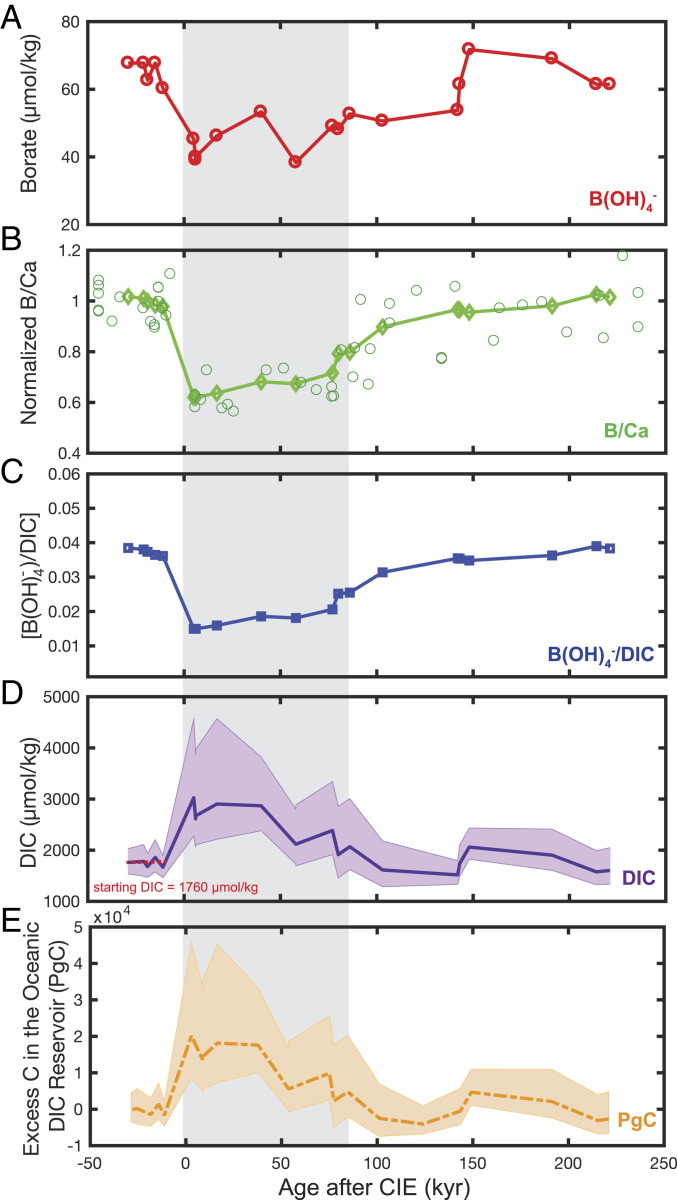
Fig. 1.
Input records and reconstructed seawater DIC from ODP Site 1209. The shaded gray region in A–E denotes the peak-PETM interval (as defined by ref. 3). (A) [B(OH)4−] was calculated using the δ11B-derived pH record of ref. 3, assuming a pre-PETM pH of 7.8 (ref. 20). (B) Measured B/Ca from ODP Site 1209 (ref. 3) has been normalized to the pre-PETM baseline B/Ca (69.5 µmol/mol) and is shown in open circles, whereas the five-point running mean of normalized B/Ca is shown in diamonds. (C) Culture calibrations (ref. 15) were used to calculate B(OH)4-/DIC. (D) Reconstructed DIC given calculated B(OH)4-/DIC (C) and B(OH)4- (A). Shaded purple regions on reconstructed DIC denote 95% CIs, derived from uncertainties on calculated [B(OH)4−] (C), normalized B/Ca (B), and the calibration slope. (E) Associated increase in the size of the oceanic DIC reservoir, assuming that the DIC excursion in (D) applies to the whole ocean volume.

