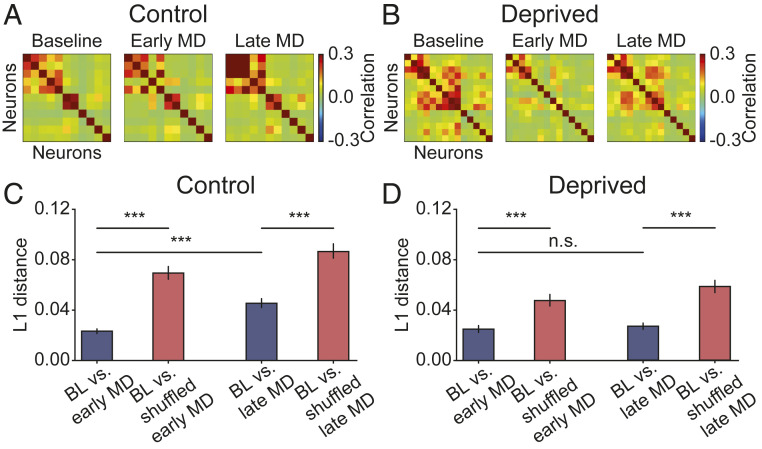
Fig. 2.
Structure of correlation matrices is maintained after recovery. (A) Example correlation matrix of 11 neurons from 1 control hemisphere at 3 different time points. (B) Same as A but of 14 neurons from 1 deprived hemisphere. (C) L1 distance between correlations at BL and early MD, and at BL and late MD, vs. shuffled data for control hemispheres. (D) Same as C for deprived hemispheres. Data are shown as means SEM. ***P < 0.001; n.s., not significant (P > 0.05) (Wilcoxon signed-rank test).

