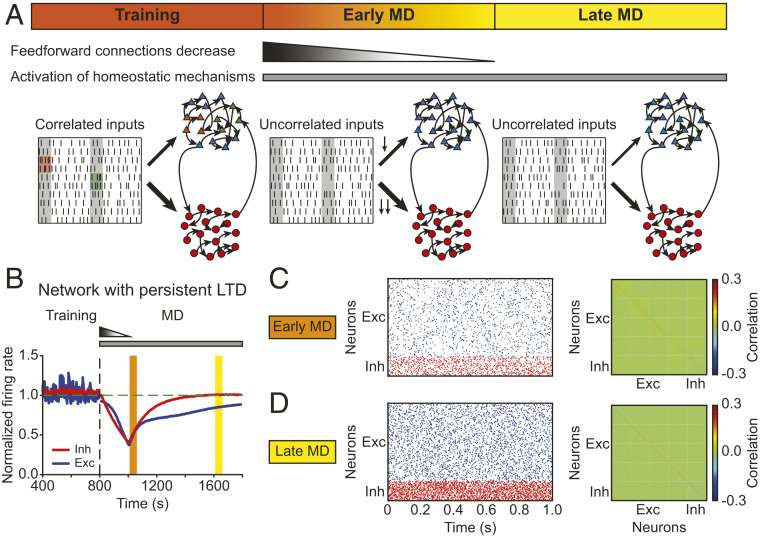
Fig. 4.
The model with persistent Hebbian LTD and homeostatic plasticity fails to recover correlations. (A) Schematic description of the modeling framework during MD. The network consists of 80% excitatory neurons (triangles) and 20% inhibitory neurons (circles). Both of them receive thalamic inputs, and thalamocortical connections onto inhibitory neurons are stronger than onto excitatory neurons. Neurons receive correlated input during training at BL (Left) but uncorrelated input during early MD (Middle) and late MD (Right). During early MD, thalamocortical connections onto both excitatory and inhibitory neurons are depressed following a linear function in time, with thalamocortical connections onto inhibitory neurons depressed more strongly. The connections remain fixed during late MD. (B) The average normalized firing rates of excitatory (blue) and inhibitory (red) neurons. The vertical dashed line indicates the onset of MD. The horizontal dashed line indicates a normalized firing rate of 1.0. (C, Left) Spontaneous activity of excitatory (blue) and inhibitory (red) neurons during early MD. (C, Right) Correlation matrix during early MD indicated by the orange region in B. (D) Same as C but during late MD indicated by the yellow region in B.

