Fig. 2.
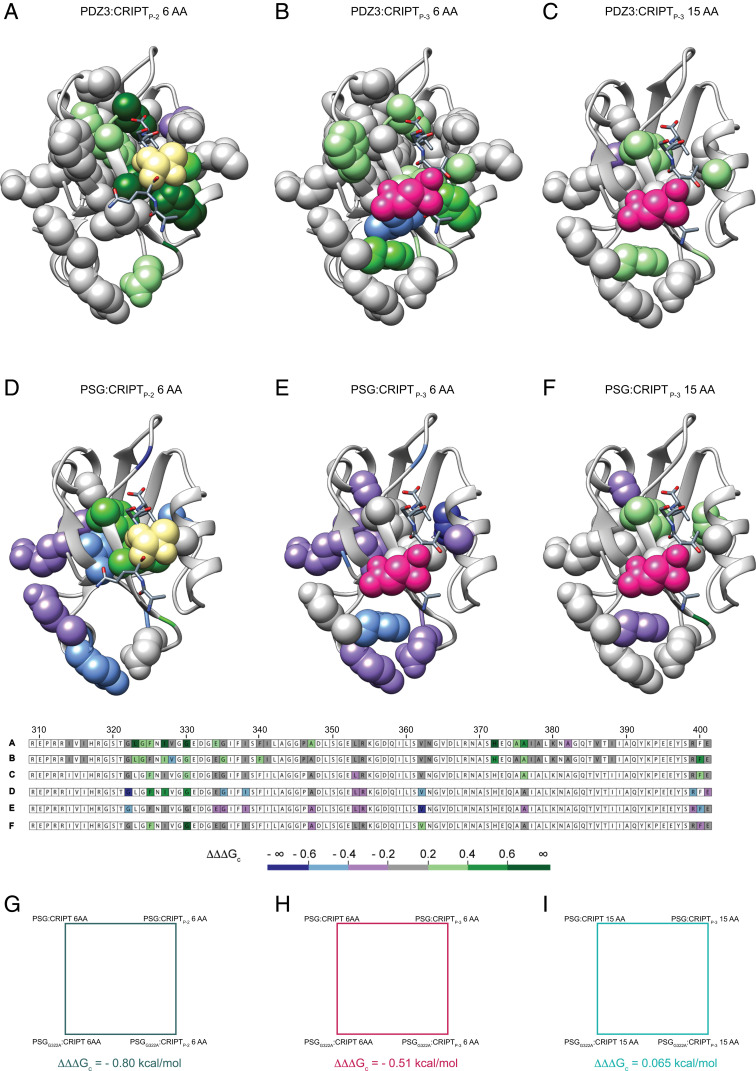
The allosteric network in PDZ3 is modulated by peptide side chain, peptide length, and presence of SH3–GK. The allosteric network, defined in terms of ∆∆∆Gc values mapped onto the PDZ3:CRIPT complex (Protein Data Bank ID code: 1be9) for six different cases, where A–C display data on the isolated PDZ3 domain and D–F on the PSG supramodule. (A and D) Coupling free energies between the hydroxyl group of Thr-2 in CRIPT to residues in single domain PDZ3 (A) or PDZ3 in PSG (D) (peptide perturbation Thr-2 → Abu, CRIPTP-2 6 AA). (B and E) Coupling free energies from the amide moiety of Gln-3 in CRIPT to residues in single domain PDZ3 (B) or PDZ3 in PSG (E) (CRIPTP-3 6 AA, peptide perturbation Gln-3 → Nva). (C and F) Coupling free energies from the amide moiety of Gln-3 in CRIPT to residues in single domain PDZ3 (C) or PDZ3 in PSG (F) (peptide perturbation Gln-3 → Nva, CRIPTP-3 15 AA). The residue probed by mutation in CRIPT is shown as yellow (P-2, Thr-2 → Abu) or pink (P-3, Gln-3 → Nva) spheres. The side chains probed by mutation in PDZ3 are depicted as spheres with a color code corresponding to the coupling free energy between the peptide and PDZ3 side chains. The primary structure of PDZ3 (residues 309 to 401) is shown below the structures and color-coded based on coupling free energies. (G, H, and I) Three examples of double-mutant cycles involving the G322A mutation in PDZ3 and Thr-2 → Abu or Gln-3 → Nva in CRIPT. Each resulting coupling free energy is represented by side chains depicted as spheres in A–F.

