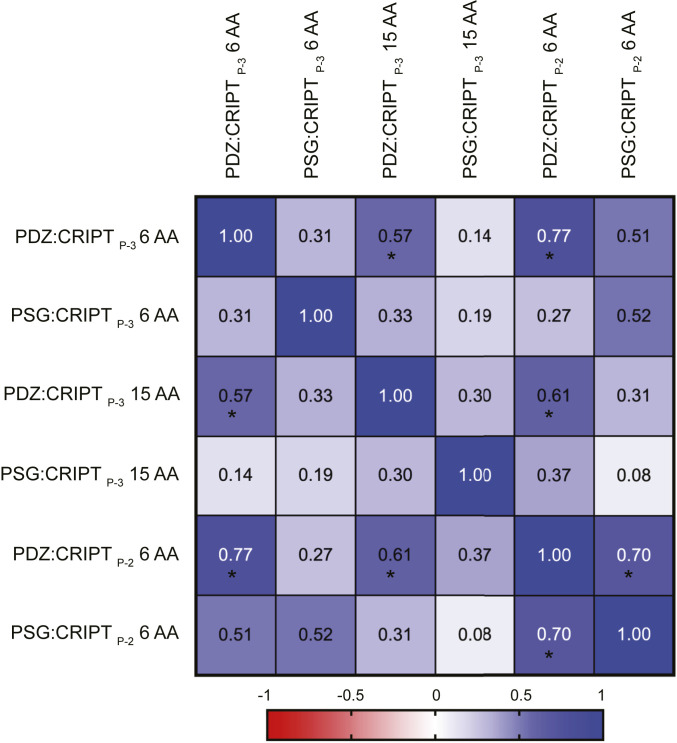
Fig. 4.
Spearman correlation analysis of the six mapped allosteric networks involving PDZ3. The diagram reports Spearman rank correlation values for six allosteric networks defined by pairwise coupling free energies between residues in PDZ3 and CRIPT. The single domain PDZ3 or PSG was mapped by 14 point mutations in PDZ3 combined with 2 point mutations in CRIPT (Thr-2 → Abu or Gln-3 → Nva) and for two different CRIPTs, a 6-mer or a 15-mer (CRIPTP-2 6 AA, CRIPTP-3 6 AA or CRIPTP-3 15 AA). The color code going from dark blue (positive) to red (negative) shows the direction and strength of any monotonic relationship. A correlation is marked by * when the P value is <0.05.

