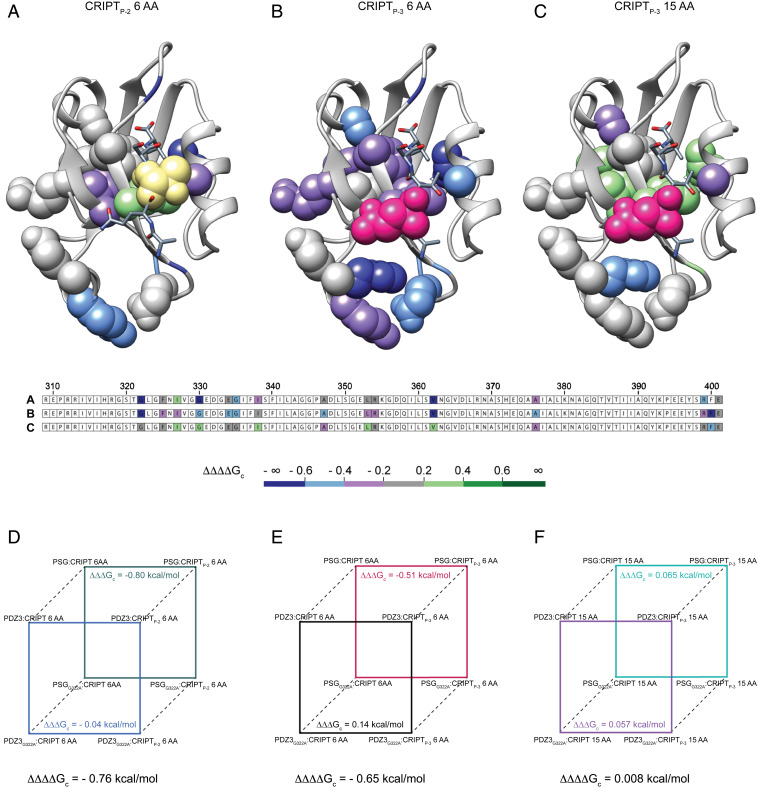
Fig. 6.
Differences between the allosteric networks in PDZ3 and PSG. The coupling free energies obtained with the single PDZ3 domain were subtracted from those of PSG for the corresponding positions to visualize the effect of SH3–GK on the allosteric network in PDZ3 upon CRIPT binding. The three panels show the resulting ∆∆∆∆Gc values (= ∆∆∆GcPSG − ∆∆∆GcPDZ3) for the respective CRIPT residue (Thr-2 or Gln-3) and peptide and for each tested residue in PDZ3, mapped onto the PDZ3:CRIPT complex. (A) CRIPTP-2 6 AA, (B) CRIPTP-3 6 AA, and (C) CRIPTP-3 15 AA. The residue probed by mutation in CRIPT is shown as yellow (P-2, Thr-2 → Abu) or pink (P-3, Gln-3 → Nva) spheres. The side chains probed by mutation in PDZ3 and PSG are depicted as spheres with a color code corresponding to the difference in coupling free energy (∆∆∆∆Gc) between PSG and PDZ3 for the respective side chain. Residues with gray color show a similar response in PDZ3 and PSG to the mutational perturbation of the allosteric network. (D–F) To illustrate how the ∆∆∆∆Gc values were calculated, thermodynamic cubes are shown for three cases representing A–C. Thus, each ∆∆∆∆Gc value is based on three perturbations: (D) Gly322→Ala, Thr-2→Abu (in 6-mer CRIPT) and PDZ3→PSG, (E) Gly322→Ala, Gln-3→Nva (in 6-mer CRIPT) and PDZ3→PSG, and (F) Gly322→Ala, Gln-3→Nva (in 15-mer CRIPT) and PDZ3→PSG.

