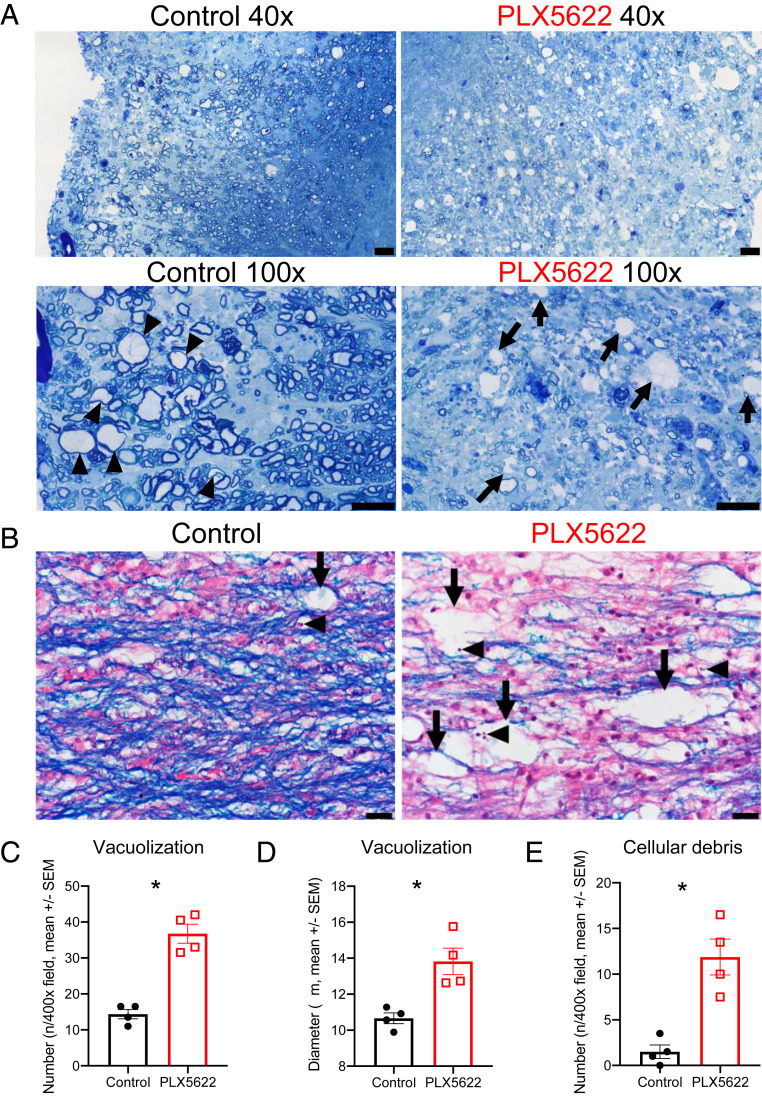
Fig. 5.
Increased vacuolization and cellular debris in PLX5622-treated mice. Mice were infected and fed with PLX5622-containing or control chow starting at 7 dpi. Representative images of toluidine blue-stained spinal cords at 21 dpi (arrows: vacuoles; arrowheads: remyelinating axons) (A). Representative images of LFB-stained spinal cords at 21 dpi with vacuolization (arrows) and pyknotic nuclear debris (arrowheads) (B). Graphs show quantification of vacuole numbers (C) and size (D) as well as quantification of cellular debris (E). Images in A are representative of three mice per group. Images and quantification in B–E are representative of two fields per mouse and four mice per group (Scale bars, 20 μm.) Data represent the mean ± SEM, *P < 0.05 by Mann–Whitney U test.

