Fig. 1.
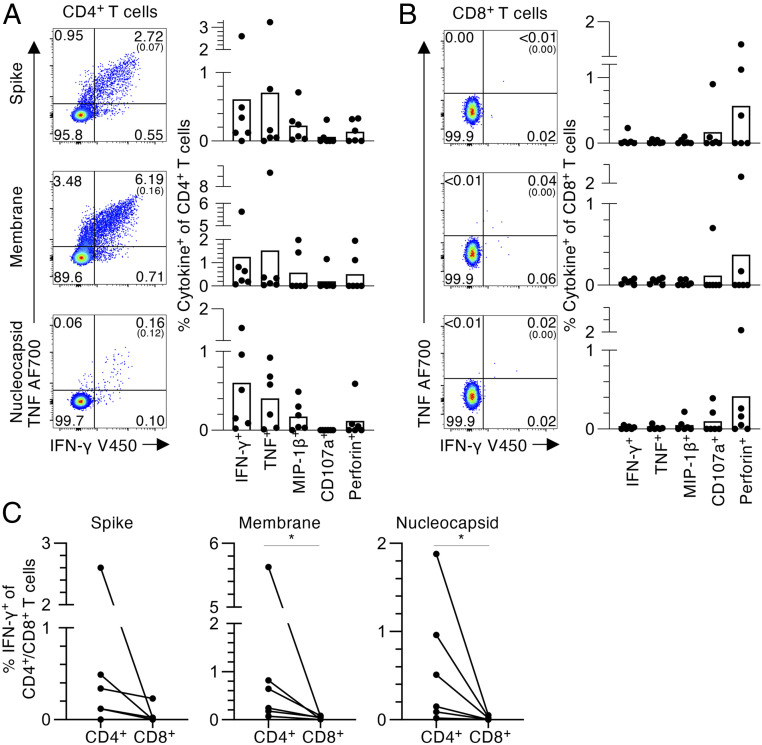
CD4+ and CD8+ T cell responses to SARS-CoV-2 overlapping peptide pools. (A) CD4+ and (B) CD8+ T cell responses to SARS-CoV2 S, M, and N peptide pools in convalescent COVID-19 individuals. (i) Representative fluorescence-activated cell sorter (FACS) plots showing IFN-γ and TNF staining of (A) CD4+ or (B) CD8+ T cell populations. (ii) Frequencies of IFN-γ+, TNF+, MIP-1β+, CD107a+ or perforin+ within the (A) CD4+ or (B) CD8+ T cells, with background staining subtracted (n = 6, mean). Background staining values are shown in brackets. Data points show individual COVID-19 convalescent subjects. (C) Paired frequencies of IFN-γ+ CD4+ and CD8+ T cells for S, N, and M peptide pools. Statistical significance was determined with Wilcoxon matched-pairs signed rank test, *P < 0.05.

