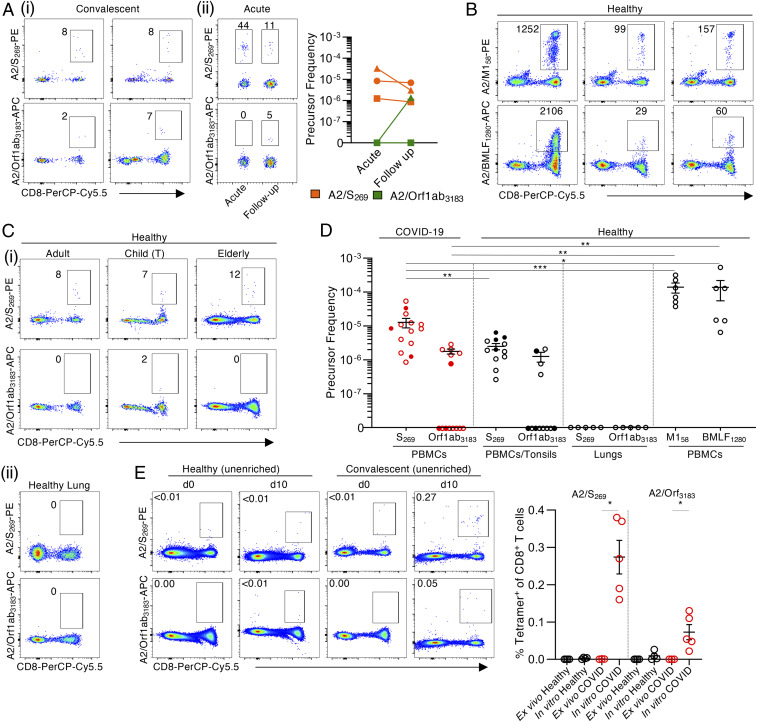
Fig. 3.
Low ex vivo frequency of SARS-CoV-2−specific A2/CD8+ T cell specificities in acute and convalescent COVID-19 patients. A2/S269+CD8+ and A2/Orf1ab3183+CD8+ T cells were identified directly ex vivo from healthy (pre−COVID-19) PBMCs, tonsils, and lungs, as well as acute and convalescent COVID-19 PBMCs by tetramer magnetic enrichment. (A) Representative FACS plots of A2/S269+CD8+ and A2/Orf1ab3183+CD8+ T cells from enriched samples of (i) convalescent and (ii) acute COVID-19 PBMCs. (B) Representative FACS plots of A2/M158+CD8+ and A2/BMLF1280+CD8+ T cells from enriched healthy PBMCs. (C) Representative FACS plots of A2/S269+CD8+ and A2/Orf1ab3183+CD8+ T cells from (i) enriched adult and elderly PBMCs, and child tonsils (T) and (ii) tetramer staining of human lung tissue. (D) A2/CD8+ T cells precursor frequencies were calculated for A2/S269+CD8+, A2/Orf1ab3183+CD8+, A2/M158+CD8+, and A2/BMLF1280+CD8+ T cells enriched from either PBMCs or tonsils, or stained in lungs. Dots represent individual donors. Means ± SEM are shown. Red dots are COVID-19 acute (closed circle) and convalescent (open circle) donors. Black dots are healthy adult or elderly PBMCs (open circle), or MNCs from child tonsils (closed circle). Donors with undetectable precursor frequencies of 0 are included on the graph to show the number of donors tested. These donors were not included in statistical analyses. Statistical significance was determined with two-tailed Mann−Whitney U test, *P < 0.05, **P < 0.01, ***P < 0.001. (E) Representative FACS plots and frequencies of A2/SARS-CoV-2+CD8+ T cells in the CD8+ population in healthy and convalescent donors on d0 and d10 of expansion. Dots represent individual donors. Statistical significance was determined using a two-tailed Mann−Whitney U test, *P < 0.05.

