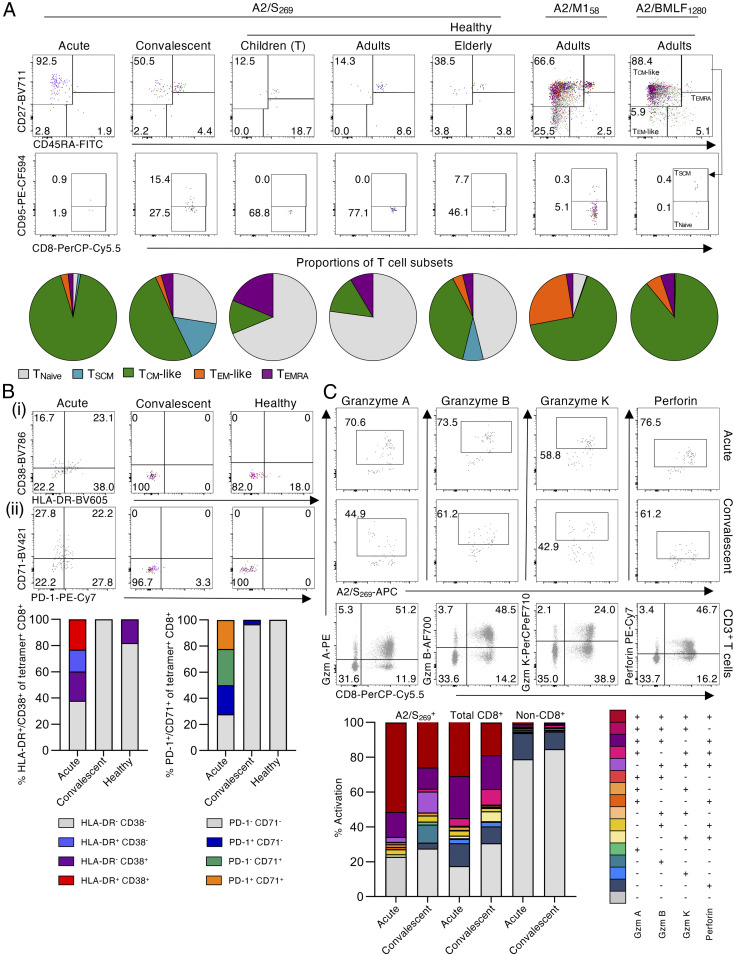
Fig. 4.
Ex vivo activation profiles of SARS-CoV-2−specific A2/CD8+ T cells in COVID-19 subjects. (A) Overlaid FACS plots of A2/S269+CD8+ T cells from acute COVID-19 (n = 3), convalescent COVID-19 (n = 11), healthy children (tonsils) (n = 4), healthy adults (n = 4), or healthy elderly donors (n = 4) show TNaïve (CD27+CD45RA+CD95−), TSCM (CD27+CD45RA+CD95+), TCM-like (CD27+CD45RA−), TEM-like (CD27−CD45RA−), and TEMRA (CD27−CD45RA+) subsets. Pie charts display the proportion of each phenotype subset based on the combined data per each COVID-19 or healthy donor group. Overlaid FACS plots of A2/M158+CD8+ and A2/BMLF1280+CD8+ T cell memory phenotypes from healthy adults are also shown. (B) Overlaid FACS plots and combined frequencies of A2/S269+CD8+ T cells showing (i) HLA-DR and CD38 or (ii) PD-1 and CD71 activation markers for acute (n = 3), convalescent (n = 11) and healthy donors (n = 12). (C) Overlaid FACS plots and combined frequencies of A2/S269+CD8+ T cells showing granzyme A, B, and K, and perforin staining for acute (n = 2) and convalescent (n = 3) donors. Representative FACS plots from one donor showing granzymes A, B, and K, and perforin of the total CD3+ T cell population. Combination gating was used to determine the frequency of cells with one to four functions for A2/S269+CD8+, total CD8+, or non-CD8+ T cells. Graphed data across multiple COVID-19 acute, COVID-19 convalescent, or naïve subjects were combined for the activation and phenotypic analyses of A2/S269 CD8+ T cells.

