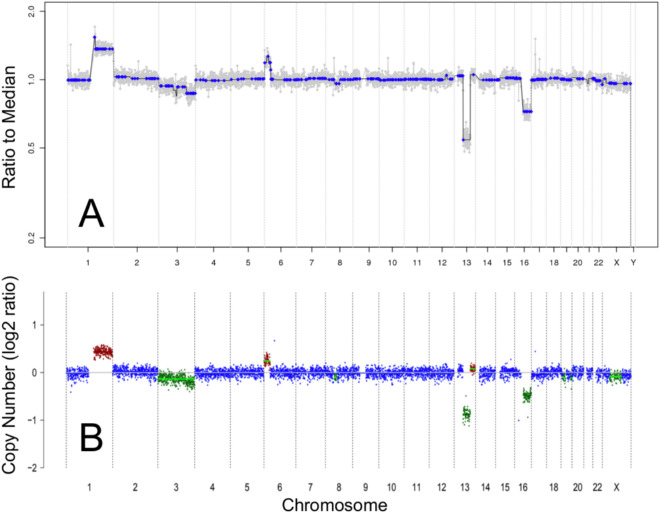
Figure 2.
Genomic profiles showing SCNAs from cell-free DNA in the aqueous humor of an eye with retinoblastoma (case 12). The genomic profiles generated by our established SCNA analysis protocol (A) were concordant with the genomic profiles generated by the ichorCNA pipeline (B). In ichorCNA profiles, the color of each data point corresponds to estimated integer copy number (green = 1 copy, blue = 2 copies, brown = 3 copies, red = 4+ copies).

