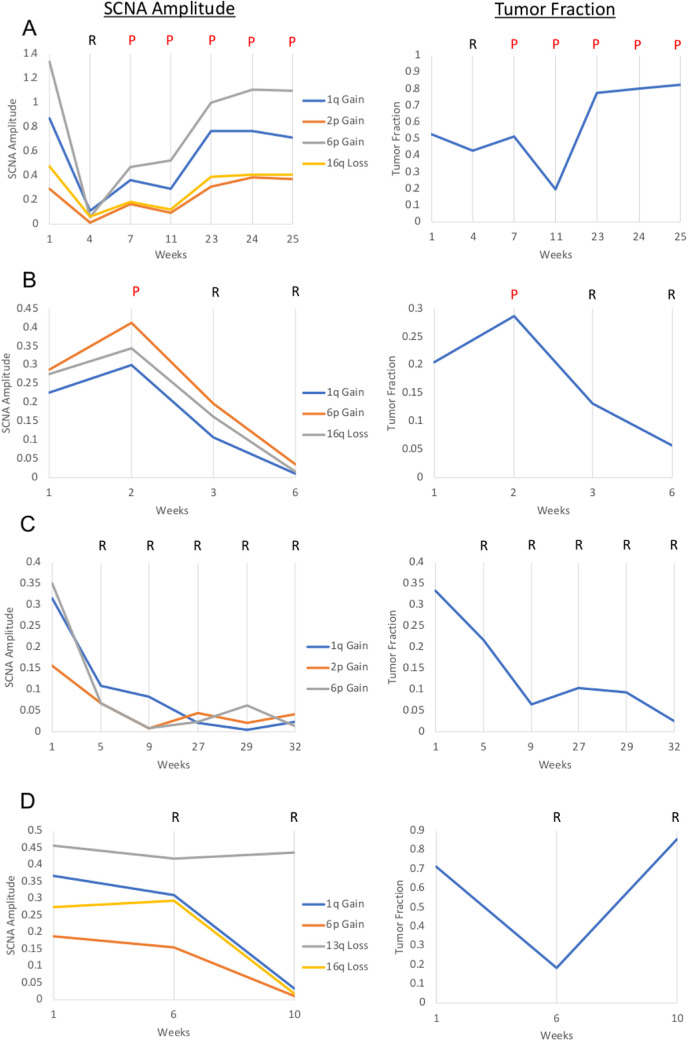
Figure 3.
SCNA absolute amplitudes and corresponding TFx for cases 6 (A), 13 (B), 40 (C), and 12 (D). Both SCNA gains and losses are represented as absolute values, determined by |1 – ratio to the median|, for visualization purposes. Clinical progression (P) or regression (R) at each sampling timepoint is shown.

