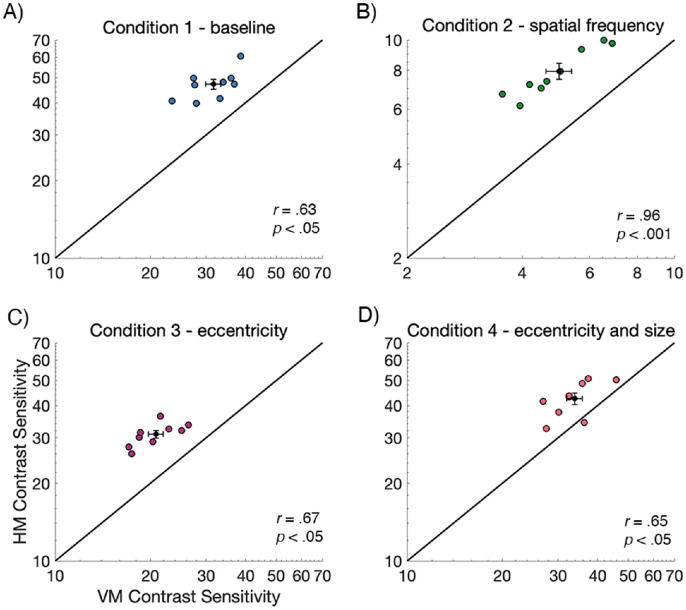
Figure 4.
Individual contrast sensitivity data from the horizontal meridian (averaged across left and right) plotted against data from the VM (averaged UVM and LVM; n = 9). The group mean ±1 SEM is presented as the black data point and error bars. Contrast sensitivity is higher along the HM than the VM for all conditions and there is a significant positive correlation between HM and VM contrast sensitivity measurements. Note that the scale of B condition 2 - SF is different from the other conditions, indicating lower contrast sensitivity for this condition. Each data point represents data for a single observer.

