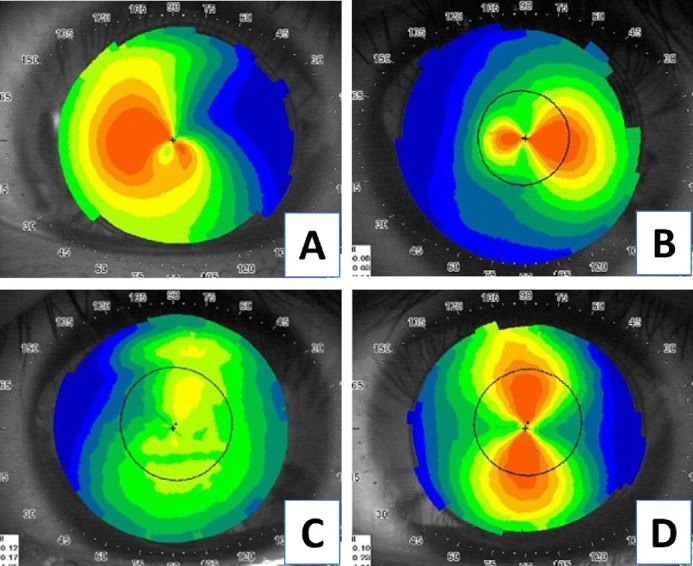
Figure 5.

The example of the trained CNN. (A) and (B) are the keratoconus group, and (C) and (D) are the control group. The algorithm predicted that (A) is keratoconus in 90%, and (B) is keratoconus in 92%; the (C) is nonkeratoconus in 88%, and (D) is nonkeratoconus in 81%.
