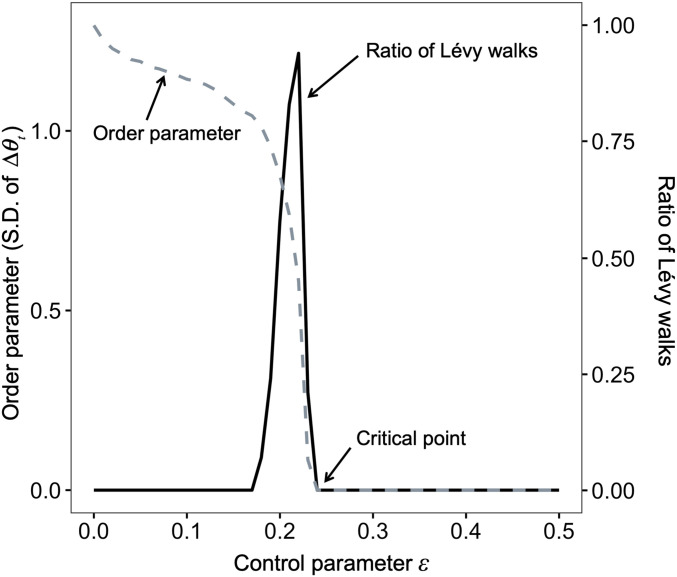
Fig. 2.
Phase diagram with a changing control parameter . The gray dashed line represents the order parameter, which is the SD of the distribution of . Near , the order parameter changes drastically. The solid black line represents the ratio of the classification of Lévy walks obtained by fitting distributions to the simulated 100 trajectories for the same parameter set. The other parameters were set to and .

