Fig. 3.
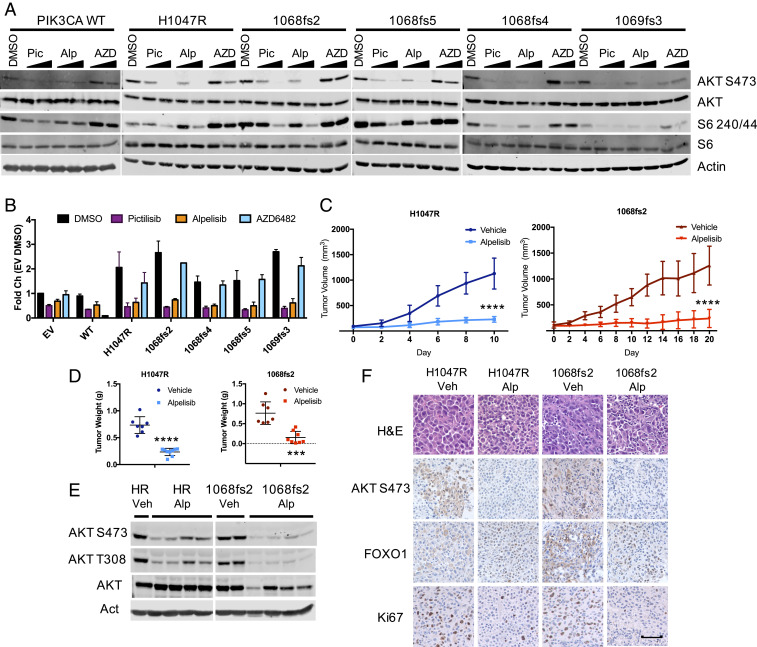
Cell lines and tumors characterized by PIK3CA C-terminal mutation are sensitive to PI3K inhibition. (A) HA-PIK3CA variant overexpressing p110α−/−; p110β−/− MEFs were starved for 4 h in the presence of pictilisib (1 μM), alpelisib (1 μM), or AZD6482 (1 μM) before immunoblotting with the indicated antibodies. (B) Crystal violet staining of HA-PIK3CA mutant overexpressing p110α−/−; p110β−/− MEFs (Left) and quantification to measure foci formation by extracted stain (Right); n = 2. (C) Tumor volume of HMEC-DDnT PIK3CAH1047R (Left) and HMEC-DDnT PIK3CA1068fs2 (Right) tumors orthotopically transplanted into the mammary fat pads of nude mice with once-daily treatment (45 mg/kg, gavage) with alpelisib. End point tumor volumes: DDnT HA-PIK3CAH1047R Veh, 1128.2 ± 303.9 mm3; DDnT HA-PIK3CAH1047R alpelisib, 229.1 ± 56.1 mm3; DDnT HA-PIK3CA1068fs2 Veh, 1259.5 ± 375.1 mm3; and DDnT HA-PIK3CA1068fs2 alpelisib, 237.1 ± 175.1 mm3. Means ± SEM are shown; all groups n ≥ 7; two-way ANOVA with Tukey’s multiple-comparisons test. ****P < 0.0001. (D) The wet weight of individual mammary tumors plus associated mammary gland tissue from PIK3CAH1047R vehicle (n = 7), PIK3CAH1047R alpelisib (n = 9) (Left), PIK3CA1068fs2 vehicle (n = 7), and PIK3CA1068fs2 alpelisib (n = 8) (Right). PIK3CAH1047R and PIK3CA1068fs2 tumors were harvested 10 and 21 d from treatment onset, respectively. Means ± SEM are shown. ***P < 0.001; ****P < 0.0001; unpaired t test. (E) Lysates prepared from tumors isolated from mice in C and immunoblotted with the indicated antibodies. (F) Tumors derived from mice in C. Sections are stained with the indicated antibodies, randomly selected images shown. (Scale bar, 50 μM.) n = 3 mice/condition.

