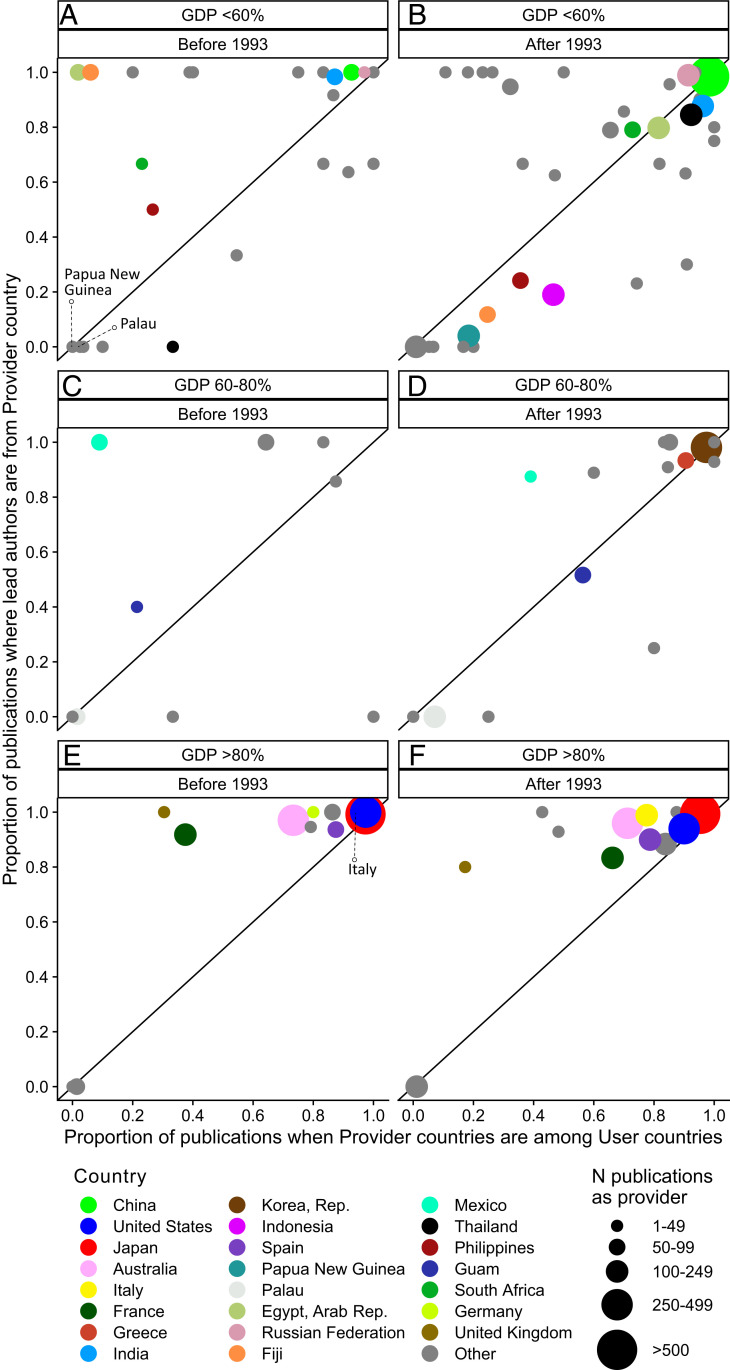
Fig. 2.
Contrast between two aspects of capacity-building among Provider countries before (A, C, and E) and after (B, D, and F) December 31, 1993, when the CBD was enforced, and grouped by GDP percentile (A and B: lower 60%; C and D: 60 to 80%; E and F: >80%). The x-axis indicates the proportion of publications where the providing countries are also User countries, i.e., participating in exploiting their own resources. The y- axis indicates whether Provider country authorships were as lead author or not. For example, as in the case of Indonesia after 1993, 0.5 on the x-axis and 0.2 on the y-axis indicate that at least one author affiliated with this country appears in 50% of all publications and is lead author (first or last position) in 20% of those publications. Hereafter, countries that are above the 1:1 line are lead authors in most publications they participate in, whereas countries below the 1:1 line may participate frequently, but not necessarily as lead author (e.g., Guam). We calculated these proportions directly from all publications for the respective period; therefore, there is no SE associated with these values.

