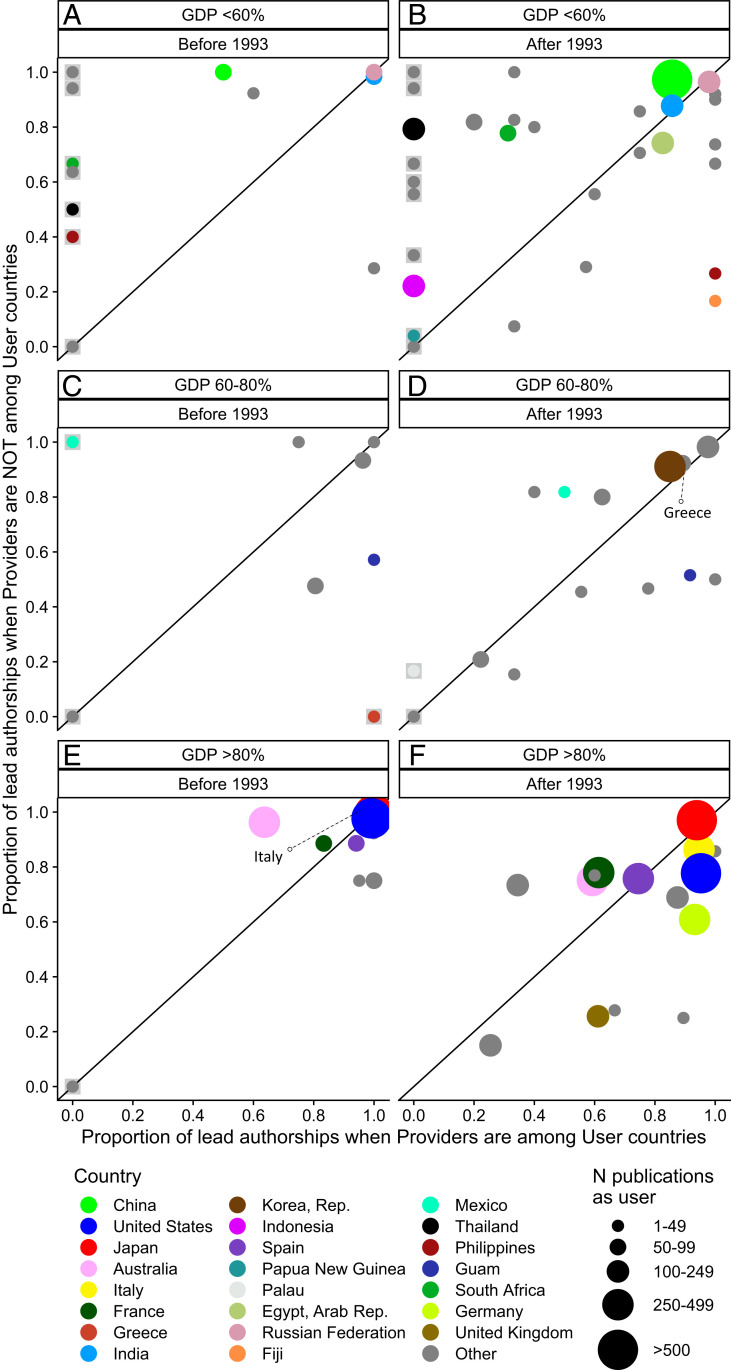
Fig. 3.
Proportion of lead authorship in User countries when Provider countries are among users (x-axis) vs. when Provider countries are not among User countries (y-axis) before (A, C, and E) and after (B, D, and F) December 31, 1993, when the CBD was enforced, and grouped by GDP percentile (A and B: lower 60%; C and D: 60 to 80%; E and F: >80%). For example, as in the case of Australia before 1993, 0.6 on the x-axis indicates that the country is lead author in only 60% of the publications where the Provider country is also participating as User but close to 100% when Provider countries are not among User countries. Hereafter, points that lie below the 1:1 line indicate that a User country has fewer lead authorships when Provider countries are present. This might be an indication of User countries being actively engaged in the scientific capacity of Provider countries through multinational collaborations. Points above the 1:1 line show that a country has more lead authorship when the providers are absent, which may indicate that countries are frequently leading projects when they explore their own or other countries’ marine biodiversity. The gray shading at zero values indicates that a country did not participate in any publications in which Provider countries were present (x-axis zero values) or absent (y-axis zero values). We calculated these proportions directly from all publications for the respective period; therefore, there is no SE associated with these values.

