Fig. 4.
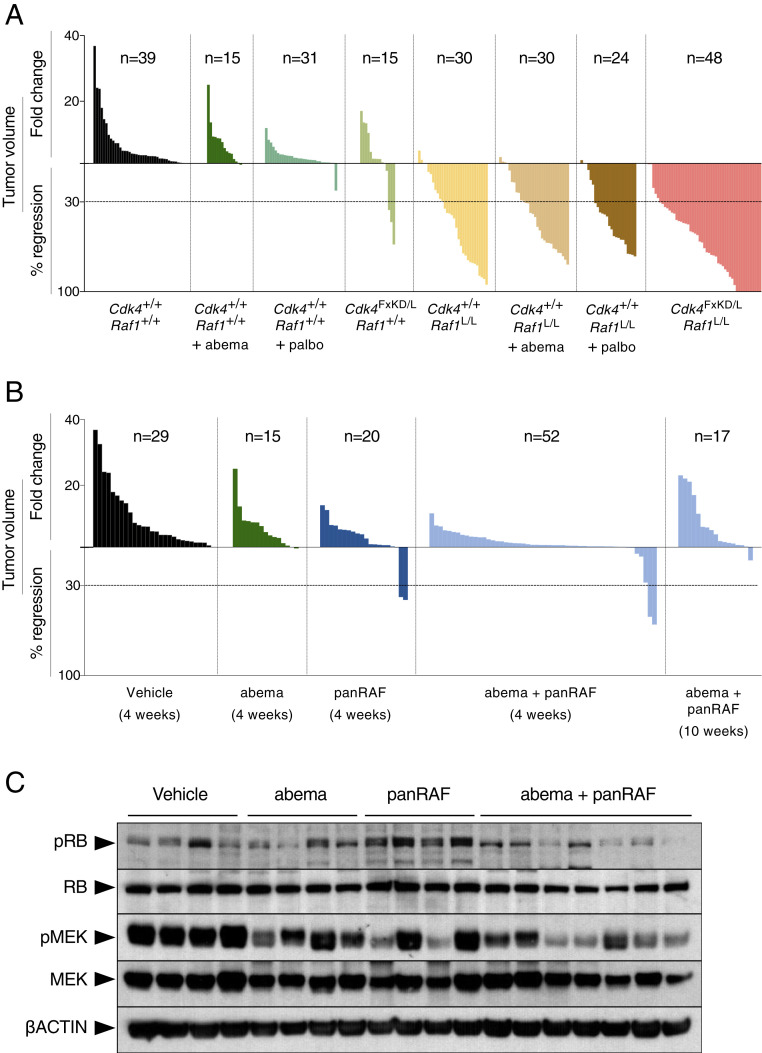
Pharmacological inhibition of CDK4/RAF1 does not phenocopy genetic inhibition. (A) Waterfall plot representing the increase in tumor volume (fold-change) and the percentage of tumor regression as determined by CT scans performed at the beginning and at the end of the trial of individual lung tumors present in Kras+/FSFG12V;Trp53F/F;hUBC-CreERT2+/T;Cdk4+/+;Raf1+/+ mice either untreated (solid bars) or treated with abemaciclib (abema; dark green bars) or treated with palbociclib (palbo; middle green bars), Kras+/FSFG12V;Trp53F/F;hUBC-CreERT2+/T;Cdk4FxKD/L;Raf1+/+ (light green bars), Kras+/FSFG12V;Trp53F/F;hUBC-CreERT2+/T;Cdk4+/+;Raf1L/L mice either untreated (yellow bars) or treated with abemaciclib (abema; brown bars) or treated with palbociclib (palbo; dark brown bars), and Kras+/FSFG12V;Trp53F/F;hUBC-CreERT2+/T;Cdk4FxKD/L;Raf1L/L mice (pink bars) exposed to TX for 4 wk. The number of tumors analyzed for each group is indicated. (B) Waterfall plot representing the increase in tumor volume (fold-change) and the percentage of tumor regression as determined by CT scans performed at the beginning and at the end of the trial of individual lung tumors present in Kras+/FSFG12V;Trp53F/F mice treated with vehicle (Vehicle; solid bars), abemaciclib (abema; dark green bars), panRAF inhibitor (panRAF; dark blue), and the combination of abemaciclib and panRAF for the indicated number of weeks (light blue bars). The number of tumors analyzed for each group is indicated. (C) Western blot analysis of phospho-RB (pRB), RB, phospho-MEK (pMEK), MEK1/2 (MEK), expression in lysates obtained from representative tumors described in B. β-Actin was used as loading control. Migration of the above proteins is indicated by arrowheads.

