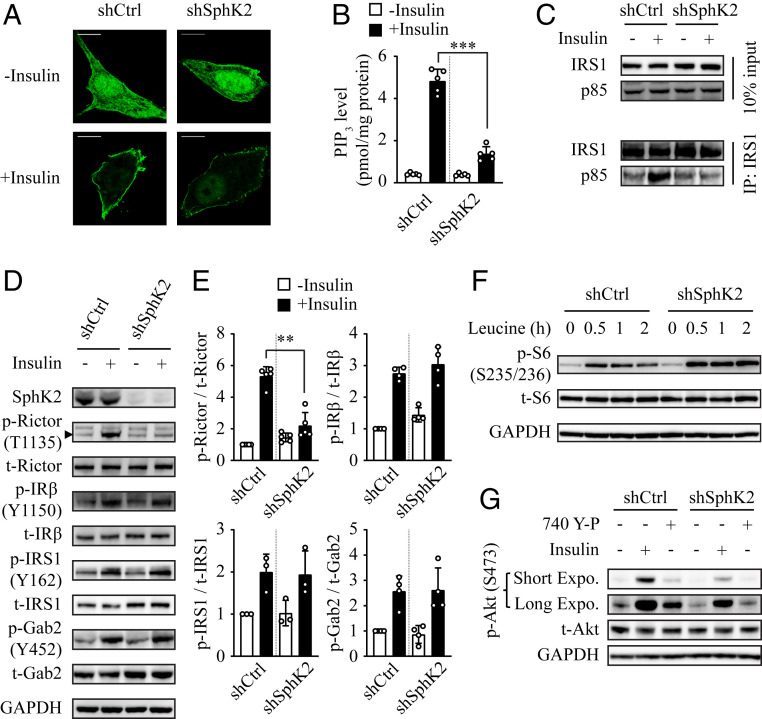
Fig. 5.
Effect of SphK2 on insulin-induced PI3K activation. SphK2 was knocked down in Huh7 cells using lentiviral-based shRNA. (A) PIP3 was visualized by the transfection of GFP-tagged Akt-PH. Bar, 10 μm. (B) PIP3 level was quantified using ELISA; n = 5. (C) Coimmunoprecipitation assay detecting the physical interaction between IRS1 and p85 subunit of PI3K. (D and E) Phosphorylation of the indicated proteins in insulin-signaling pathway was examined in cells treated with 10 nM insulin for 15 min by Western blot analyses (D) and normalized to total protein (E); n ≥ 3. (F) Level of phospho-S6 was examined in cells treated with 1 mM leucine for the indicated times. (G) Knockdown of SphK2 inhibited 740 Y-P–induced Akt phosphorylation. Cells were treated with 10 nM insulin or 25 μM 740 Y-P for 15 min. Data are expressed as mean ± SD; **P < 0.01, ***P < 0.001.

