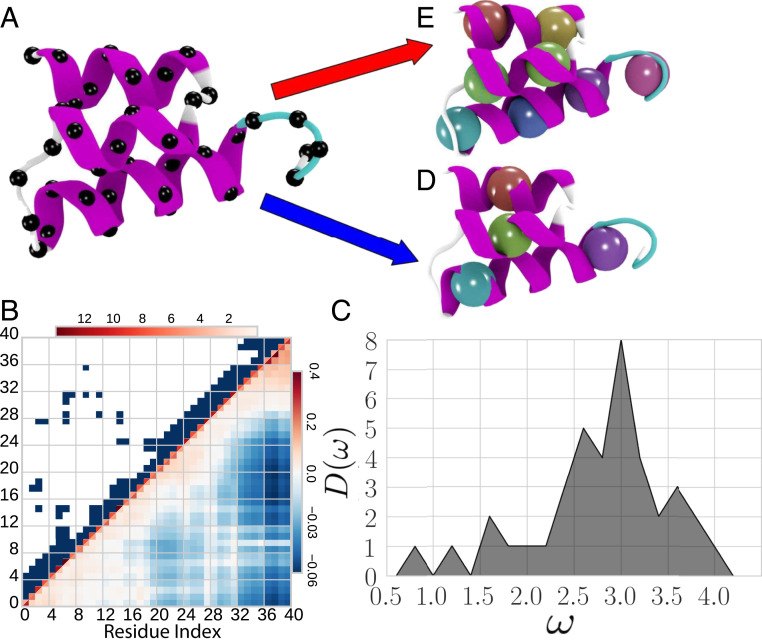
Fig. 1.
Characterization of the model protein 2ERL. (A) Cartoon representation of the equilibrium folded structure with black spheres indicating carbons. (B) Intensity plots of the upper and lower halves of the symmetric connectivity, , and covariance, , matrices. (C) Vibrational densities of states for the high resolution GNM of 2ERL. (D and E) CG representations with spheres representing the location of the CG sites for block maps with = 4 and 8 sites, respectively. Figure employed VMD (66).

