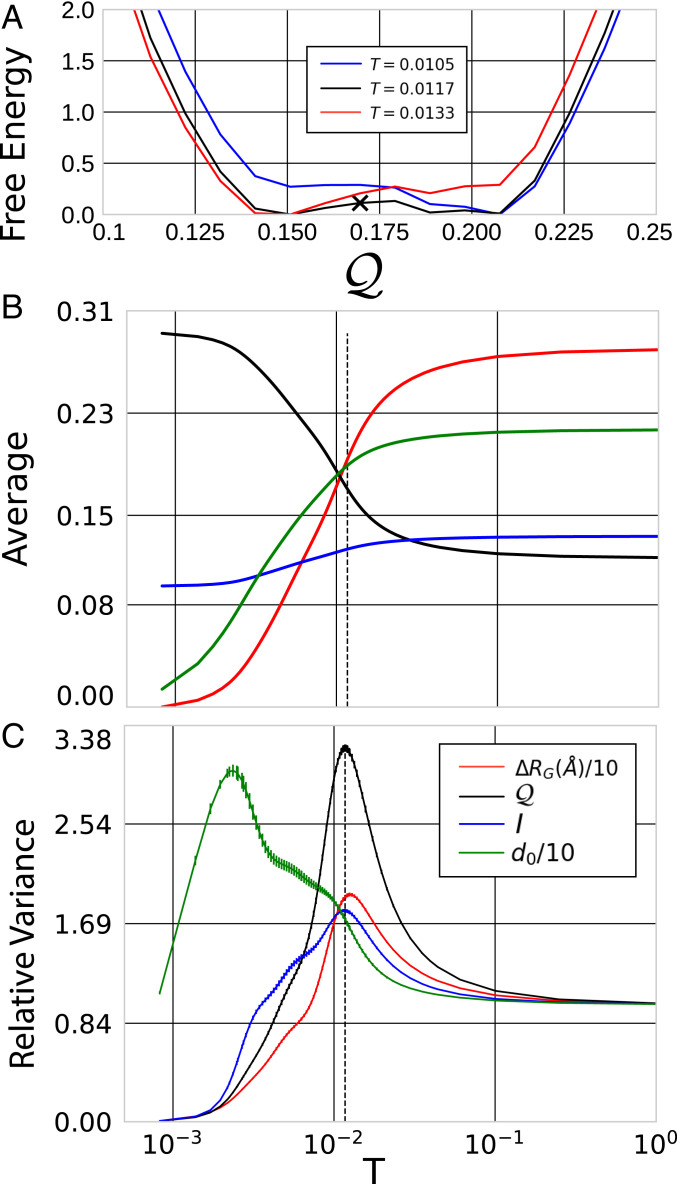
Fig. 4.
Characterization of the apparent transition for site representations of 2ERL. (A) The dimensionless free energy, , at the transition temperature (black) and at temperatures above (red) and below (blue) the transition. The black X indicates the separatrix, , for which at the transition temperature. (B and C) The averages and variances, respectively, for several metrics. The metric quantifies the difference in the atomic groups defined by the map, , and the ground state map, , while quantifies the compactness of the associated atomic groups. For convenience, we have shifted such that vanishes as and have normalized variances relative to their limit. Error bars estimate statistical uncertainty. The dashed vertical line indicates the transition temperature, which is defined by the variance peak in . T denotes the fictitious temperature, , conjugate to = 1- .

