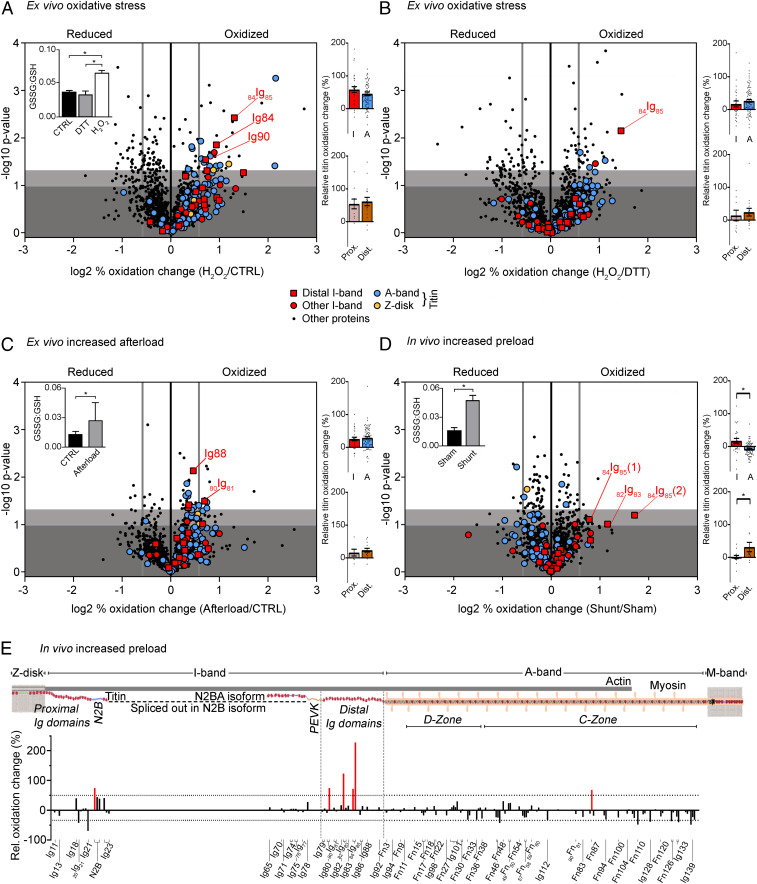
Fig. 1.
Redox state of cardiac proteins in different mouse heart models. Volcano plots of peptides identified in the Langendorff H2O2 perfusion (n = 3) vs. control (n = 3) (A) or DTT (n = 3) (B), afterload-increase heart model (n = 4 for control and afterload increase) (C), and in vivo shunt (n = 4) vs. sham (n = 3) model (D). The difference in (log2) percentage oxidized was used. A threshold value of +0.58/−0.58 was chosen for redox classification (thick vertical gray line). Nonsignificant changes, dark gray background; sites trending toward significances between −log10 1.00 to 1.30, light gray background; and significantly altered sites above −log10 of 1.30, white background. Insets: GSSG:GSH ratio for H2O2 Langendorff perfusion (A; n = 6), afterload increase (C; n = 9) and shunt vs. sham (D; n = 4). Colored bar graphs on Right: percentage oxidation increase in I-band vs. A-band titin (Top) and proximal vs. distal I-band titin (Bottom). Data are means ± SEM *P < 0.05, two-tailed Mann–Whitney U test. For data in Insets, significance was tested by ANOVA, followed by Tukey’s test (A) or unpaired, two-tailed Student’s t test (C and D). (E) Schematic of mouse cardiac titin and bar graph showing the percentage oxidation change against the associated titin domains (UniProtKB ID A2ASS6). Increases by >50% are highlighted in red.

