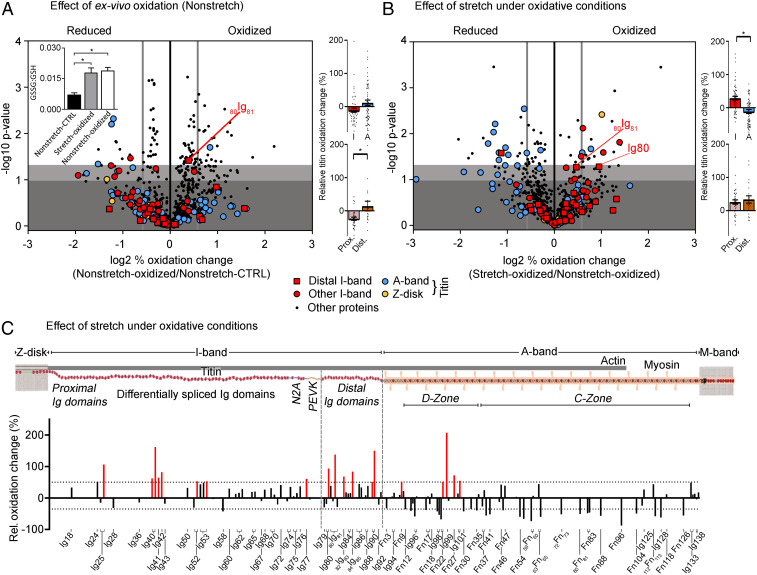
Fig. 2.
Redox state of the skeletal muscle. Volcano plots of peptides identified in nonstretched oxidized (n = 3) vs. nonstretched control muscle (n = 3) (A) and nonstretched oxidized (n = 3) vs. stretched oxidized muscle (n = 3) (B). Oxidized samples were incubated in relaxing buffer containing 2 mM GSH/0.5 mM diamide. The difference in (log2) percentage oxidized was used. A threshold value of +0.58/−0.58 was chosen (thick vertical gray line) for redox classification. Nonsignificant changes, dark gray background; sites trending toward significances between −log10 1.00 and 1.30, light gray background; and significantly altered sites above −log10 of 1.30, white background. Inset in A, GSSG:GSH ratio (n = 6). Colored bar graphs on Right: percentage oxidation increase in I-band vs. A-band titin (Top) and proximal vs. distal I-band titin (Bottom). Data are means ± SEM *P < 0.05, two-tailed Mann–Whitney U test. For data in Inset (A), significance was tested by ANOVA, followed by Tukey’s test. (C) Schematic of mouse skeletal muscle titin and bar graph showing the percentage oxidation change against the associated titin domains (UniProtKB ID A2ASS6). Increases by >50% are highlighted in red.

