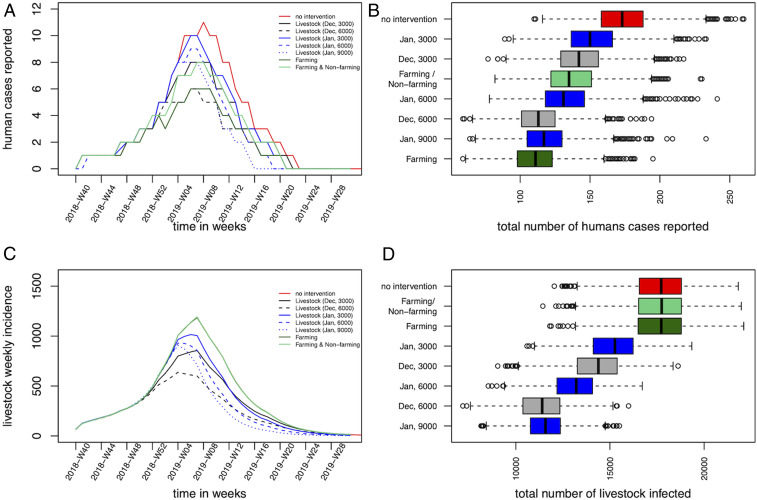
Fig. 4.
(A and D) Impact of vaccination strategies on the epidemic size. (A) Median weekly number of predicted reported incident human cases, and corresponding (B) final human epidemic size (reported cases). (C) Median weekly number of predicted incident infected livestock, and corresponding (D) total livestock epidemic size. In A and C, the red solid line presents the scenario with no intervention (scenario 1); the black lines present vaccinations in December 2018 (black solid, 3,000 doses; dashed black, 6,000 doses) (scenarios 2 and 3); the blue lines present the vaccinations in January 2019 (blue solid, 3,000 doses; dashed blue, 6,000 doses; dotted blue, 9,000 doses) (scenarios 4–6); the dark green and the light green lines represent the vaccination of farmers (scenario 7), and the vaccination of the two groups (scenario 8), respectively. Note that, in C, the curves representing the incident livestock cases for no intervention and the vaccination scenarios targeting humans overlap.

