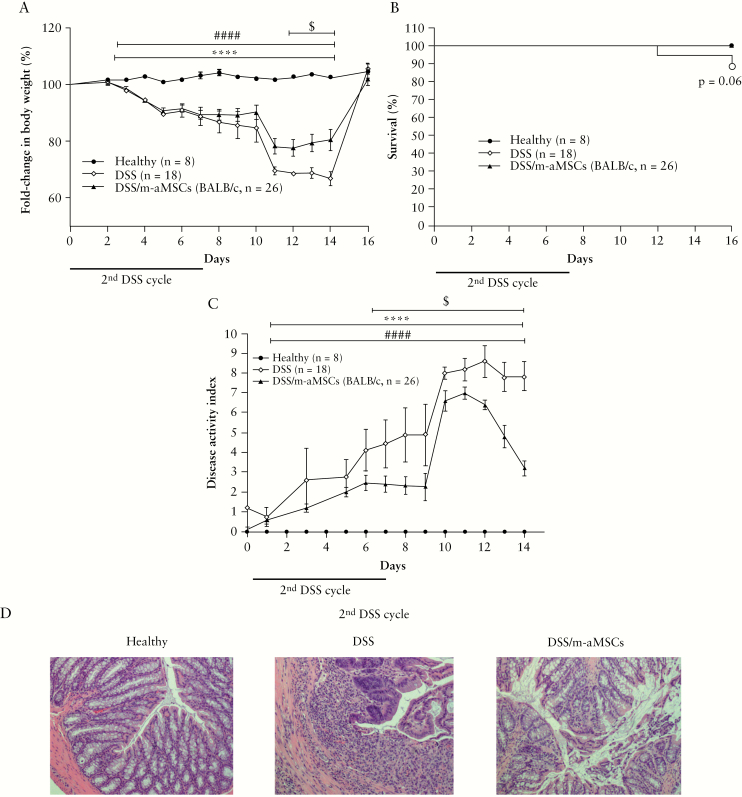
Figure 2.
Colitis status of mice determined by fold-change in body weight, survival, disease activity index, and histological analysis of colons of healthy, non-aMSC and allogeneic [from BALB/cJ mice] aMSC-treated colitic mice during the second challenge with DSS. Fold-change in body weight [A], survival [B], disease activity index [C], and representative images of colon tissue [magnification 100X] at Day 7 during the second challenge with DSS [D]. Healthy, n = 8; [1st + 2nd] DSS, n = 18; and 1st DSS/m-aMSCs + 2nd DSS, n = 26. Data are presented by mean and standard error of the mean of fold-change in body weight and disease activity index. Significance was analysed by the Mann-Whitney U test and represented by ****p ≤ 0.0001 [1st + 2nd] DSS vs healthy; ####p ≤0.0001 1st DSS/m-aMSCs + 2nd DSS vs healthy; and $p <0.05 1st DSS/m-aMSCs + 2nd DSS vs [1st + 2nd] DSS. Results correspond to three independent experiments. DSS, dextran sulphate sodium; MSCs, mesenchymal stem cells.

