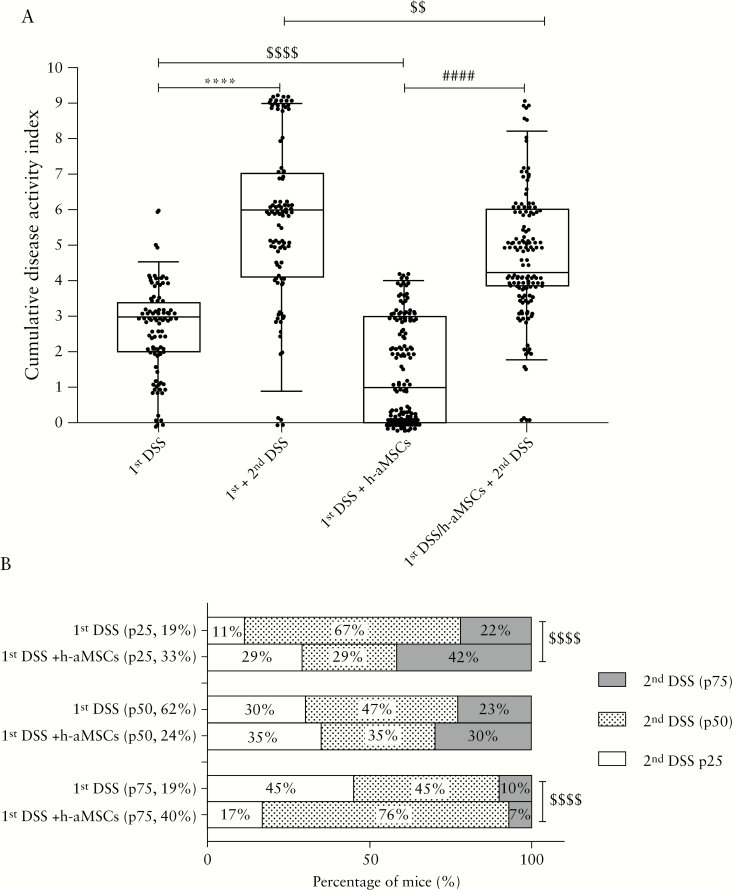
Figure 3.
Stratification and correlation of non-treated and treated with h-aMSCs in DSS-induced colitic mice based on percentile of cumulative disease activity index during the first and the second DSS cycles. Cumulative disease activity index of mice treated and non-treated with a single intraperitoneal dose of h-aMSCs during the first and second DSS cycles [A]. Contingency graph in percentage of colitic mice classified as treated and non-treated with h-aMSCs by the percentile [p25, p50, and p75] of their cumulative disease activity index during the first and second DSS cycles [B]. Data are represented in box plot graph by the median [p50 middle line] and interquartile ranges [p25 lower edge and p75 upper edge] of the cumulative disease activity index and the percentage of mice in the contingency graph in the first and second DSS cycles. Significance was analysed by the Mann-Whitney U test and Fisher´s test and represented by ****p ≤0.0001 DSS vs healthy; ####p ≤0.0001 DSS + h-aMSCs vs healthy; and $$p <0.01 and $$$$p ≤0.0001 DSS + h-aMSCs vs DSS. Results correspond to 10 independent experiments. DSS, dextran sulphate sodium; MSCs, mesenchymal stem cells.

