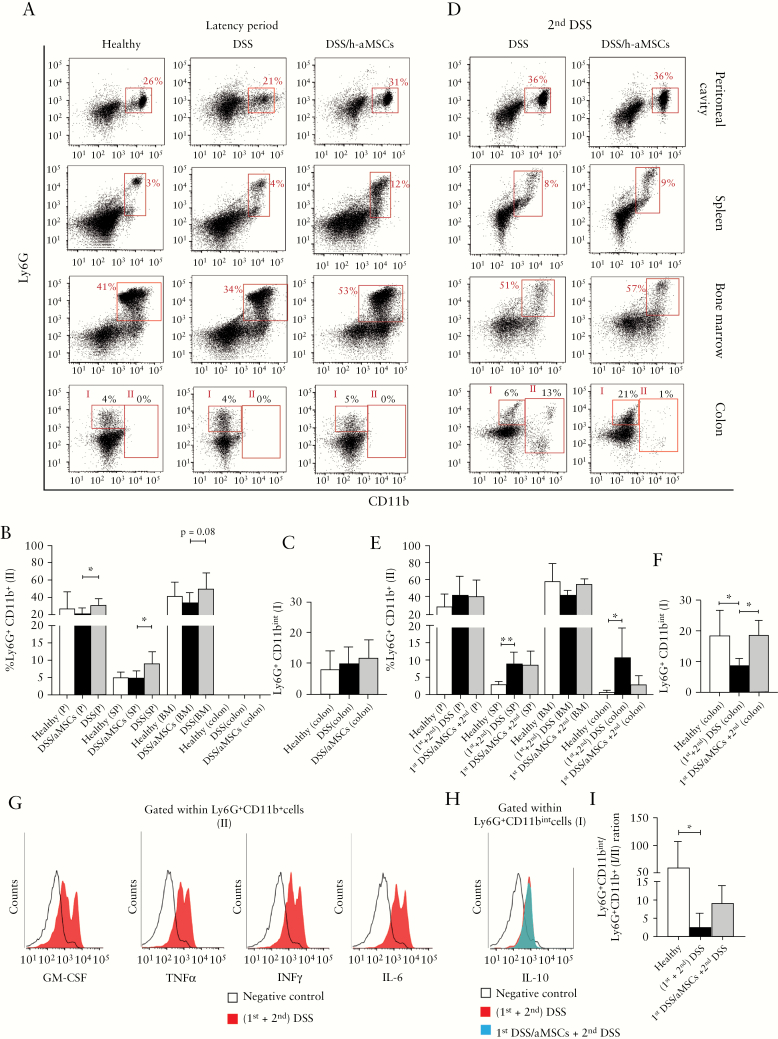
Figure 6.
Frequencies of Ly6G+CD11b+ myeloid cells measured by flow cytometry in peritoneal cavity, spleen, bone marrow, and colon during the latency period and during the second DSS treatment in non-aMSC and aMSC-treated DSS-induced colitic mice. Representative dot-plots by flow cytometry [A] and frequency expressed as percentage of Ly6G+CD11b+ myeloid cells in peritoneal cavity [P], spleen [SP], bone marrow [BM], and colon [B] and frequency expressed as percentage of Ly6G+CD11bint myeloid cells in colons [C] in healthy [n = 5], non-aMSC [n = 6], and aMSC-treated mice [n = 8] 12 weeks after the first DSS challenge. Representative dot-plots by flow cytometry [D], frequency expressed as percentage of Ly6G+CD11b+ myeloid cells in peritoneal cavity, spleen, bone marrow, and colon [E], frequency expressed as percentage of Ly6G+CD11bint myeloid cells in the colons [F], and representative histograms of GM-CSF, TNFα, IFNγ and IL-6 expression gating on Ly6G+CD11b+ myeloid cells [gate II] [G] and IL-10 expression gating on Ly6G+CD11bint myeloid cells [gate I] [H] in non-aMSC [red] and aMSC-treated colitic mice [blue] during the second DSS challenge. Ly6G+CD11bint/Ly6G+CD11b+ ratio in the colon in healthy, non-aMSC, and aMSC-treated colitic mice during the second DSS challenge [I]. Data are presented by mean and standard error of the mean of the percentage of Ly6G+CD11b+ and Ly6G+CD11bint. Significance was analysed by the MannWhitney U test and represented by *p <0.05 and **p < 0.01. Results correspond to four independent experiments. DSS, dextran sulphate sodium; MSCs, mesenchymal stem cells.

