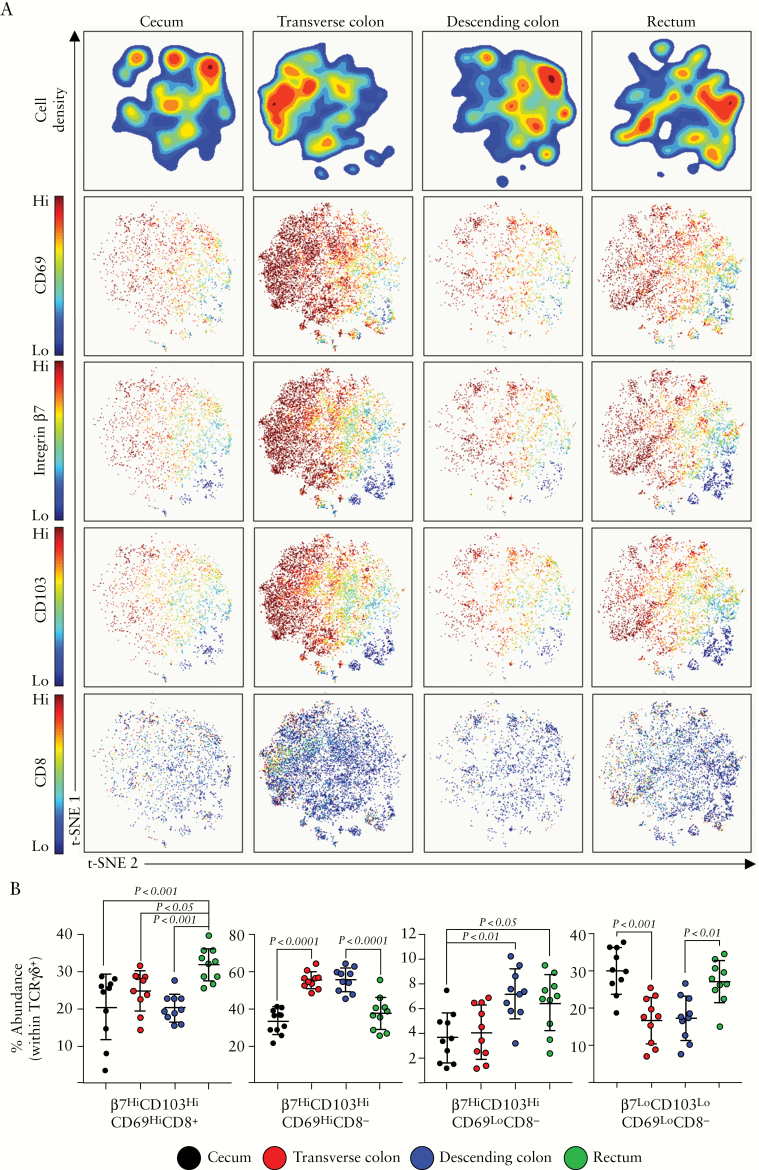
Figure 5.
TCRγδ + T cell subsets along the colonic tract. [A] opt-SNE analysis of TCRγδ + cellular events isolated from intestinal biopsies derived from the caecum, transverse, or descending colon, or rectum. Density plots are displayed, alongside plots displaying the expression of CD69, integrin β7, CD103, and CD8. [B] Proportions of the indicated TCRγδ + cellular subsets within each colonic compartment, determined using the Astrolabe profiling step,32 by limiting clusters to TCRγδ + events. Each data point represents a single donor, n = 10 total. Error bars represent standard deviation of mean. Statistical significance determined using analysis of variance [ANOVA], followed by Tukey’s multiple comparison test.

