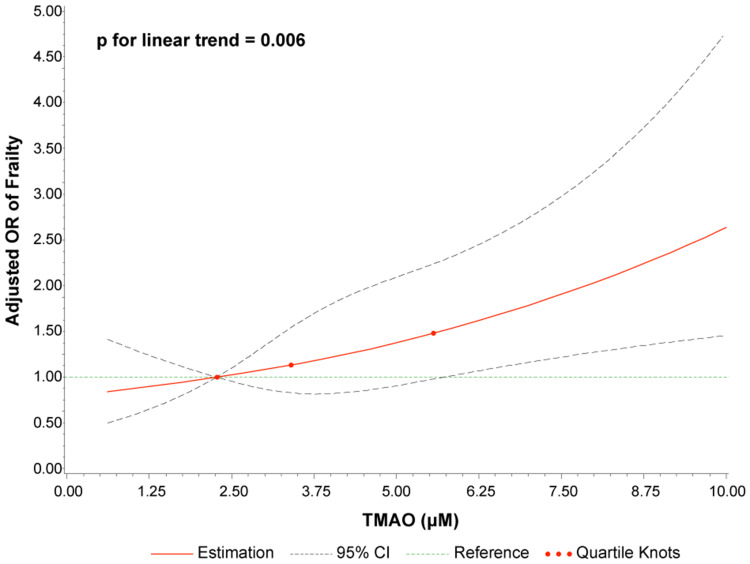
Figure 3.
Dose–response relationship of TMAO concentration with the risk of frailty. Odds ratios (solid line) and 95% confidence intervals (dashed line) were adjusted for age, sex, body mass index, diabetes, peripheral arterial disease, chronic kidney disease, stroke, left ventricular ejection fraction, high-sensitivity C-reactive protein, and low-density lipoprotein cholesterol. The 25th percentile was set as the reference, and the other two knots’ positions were fitted at the 50th and 75th percentiles.
Abbreviation: CI, confidence interval; OR, odds ratio.

