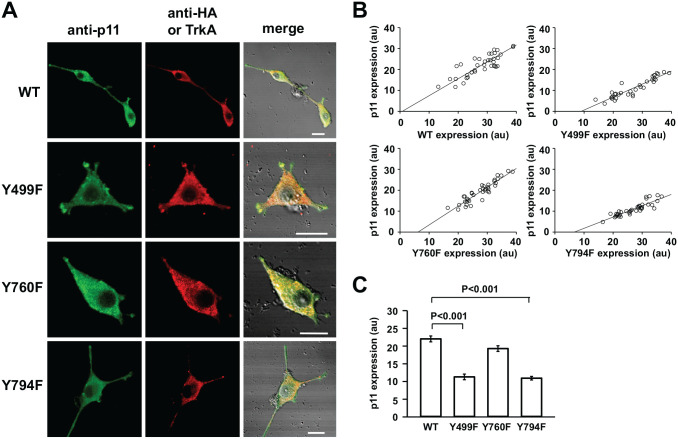
Figure 5.
Immunocytochemical analysis of signaling pathways involved in NGF-induced p11 production. (A) Confocal images of p11 and HA- or TrkA-like immunofluorescence in PC12nnr5 cells expressing wild-type (WT), Y499F-TrkA, Y760F-TrkA, or Y794F-TrkA. First and second columns represent p11- and HA- or Flag-like immunofluorescence images, respectively; third, merge of DIC and fluorescence images. HA-like fluorescence was observed in cells expressing WT, Y760F-TrkA, and Y794F-TrkA, whereas TrkA-like fluorescence was observed in cells expressing Y760F-TrkA. (B) p11-like fluorescence is plotted against those of HA- (WT, Y499F, and Y794F) or TrkA-like (Y760F) fluorescence observed in the same cells. Linear regression lines are as follows—WT: y = −0.634 + 0.810x, correlation coefficient r = 0.823; Y499F: y = −5.595 + 0.621x, r = 0.924; Y760F: y = −5.594 + 0.901x, r = 0.929; Y794F: y = −3.623 + 0.541x, r = 0.888. (C) Summary of p11-like IR material in PC12nnr5 cells expressing WT, Y499F-TrkA, Y760F-TrkA, or Y794F-TrkA. P11-like IR material was measured over the whole cell area including protrusions or neurites. Data are mean ± SEM; Kruskal–Wallis one-way analysis of variance on ranks (WT: n=38 from three culture dishes; Y499F: n=33 from two; Y760F: n=38 from three; Y794F: n=38 from 3). Bars are 10 µm. Abbreviations: DIC, differential interference contrast; HA, hemagglutinin; IR, immunoreactive; NGF, nerve growth factor; PC, pheochromocytoma.

