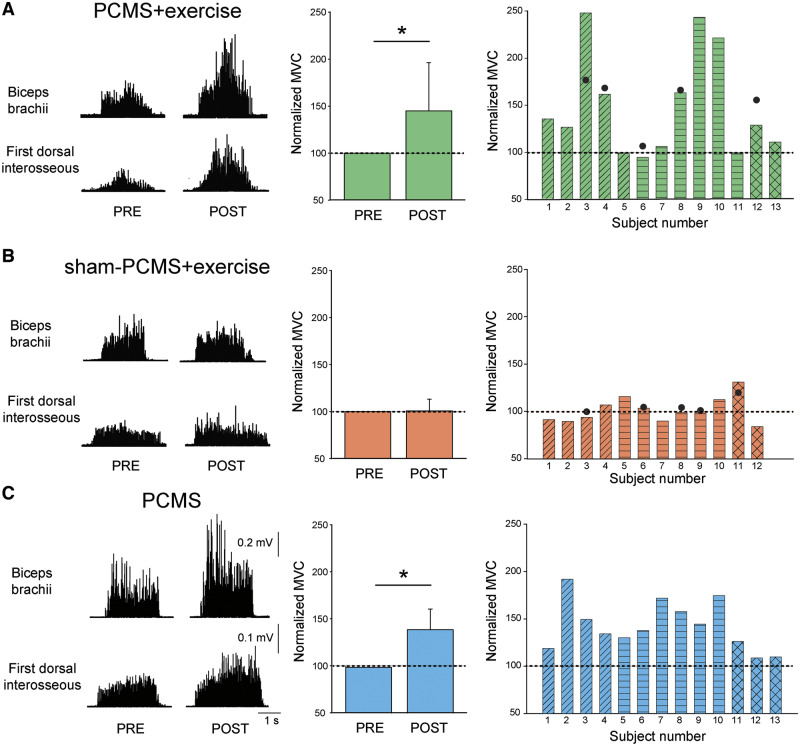
Figure 4.
MVCs. Rectified EMG traces during MVCs from six representative participants from biceps brachii and first dorsal interosseous muscles before and after 10 sessions. Graphs show group (left) and individual (right) data for PCMS+exercise (A; n = 13), sham-PCMS+exercise (B; n = 12), and PCMS (C; n = 13) groups. The x-axes of the left graphs show the time of measurements (PRE = pre-assessment; POST = post-assessment) and the y-axis shows the size of MVCs as percentage of MVCs at pre-assessment. The x-axes of the right graphs show individual subjects and filled circles indicate the 6-month follow-up results. Data of participants included in shoulder (transverse lines), hand (horizontal lines), and leg (crossed lines) block are shown for each intervention. Scale bars shown for biceps brachii and first dorsal interosseous muscles are the same across participants. Error bars indicate SDs, *P < 0.05.

