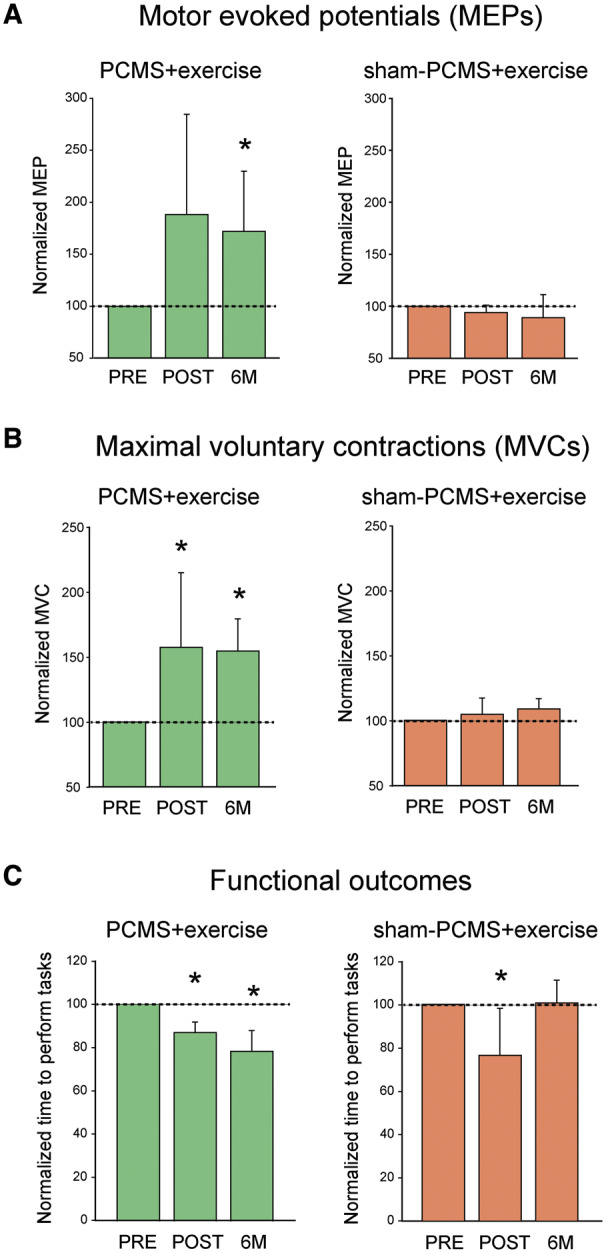
Figure 6.

Six-month follow-up results. Graphs show results after 10 sessions of PCMS+exercise (green bars) and sham-PCMS+exercise (orange bars) at the 6-month follow-up assessment. (A) MEPs (n = 5 for PCMS+exercise and 5 for sham-PCMS+exercise). The x-axis shows the time of assessments (PRE = pre-assessment; POST = post-assessment; 6M = 6-month follow-up assessment) and the y-axis shows the amplitude of MEPs as percentage of MEPs at pre-assessment (A), the MVCs as percentage of MVCs at pre-assessment (B), and the time to perform tasks as percentage of time at pre-assessment (C). Note that MEPs and MVCs increased after 10 sessions in the PCMS+exercise group and remained increased for 6 months compared with baseline but not in the sham-PCMS+exercise group. However, functional outcomes improved after 10 sessions of PCMS+exercise but did not persist 6 months later. Error bars indicate SDs, *P < 0.05.
