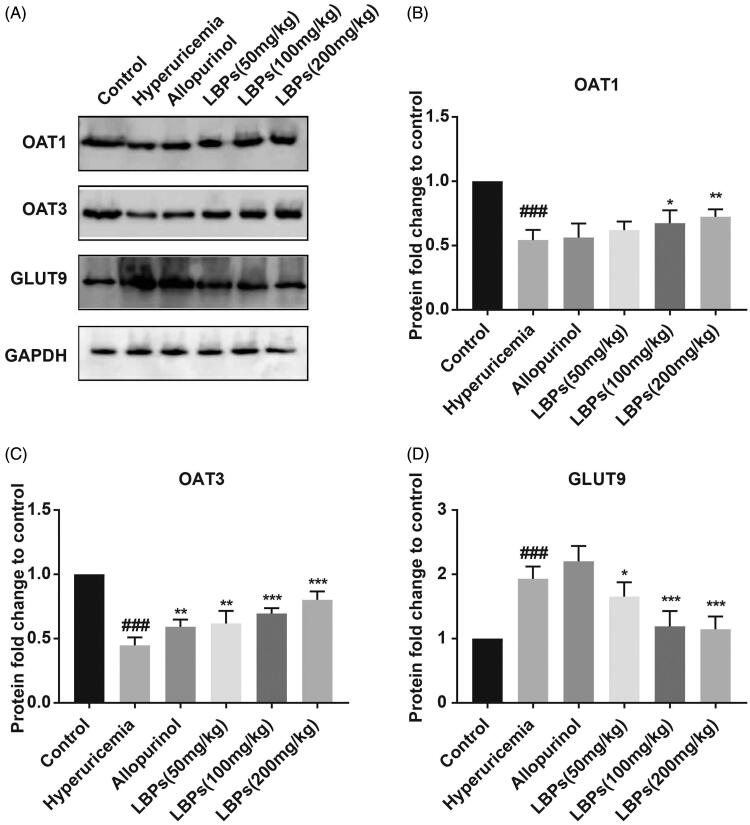
Figure 3.
Effect of LBPs on the protein levels of OAT1, OAT3 and GLUT9 in the kidney tissue of potassium oxonate-induced hyperuricemic mice. (A) The protein levels were measured by western blotting, and (B–D) densitometry was calculated. The data are presented as means ± SD, n = 6 per group. ###p < 0.001 compared with the control group. *p < 0.05, **p < 0.01 and ***p < 0.001 compared with the hyperuricaemia group.

