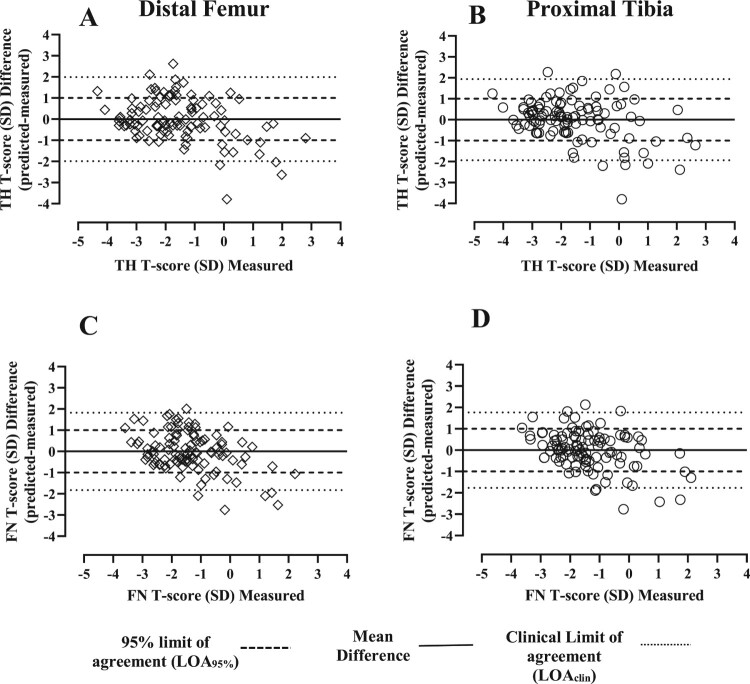
Figure 2.
Bland-Altman agreement analysis: The differences between measured and predicted T-score values were plotted against measured T-score values at the TH and FN. Prediction of T-score at the total hip and femoral neck using the DF (A and B) and PT (C and D). Solid line = mean difference. Light dashed line = 95% limit of agreement (LOA95%, mean difference ± 2SD). Thick dashed line = clinical limit of agreement (LOAclin).

