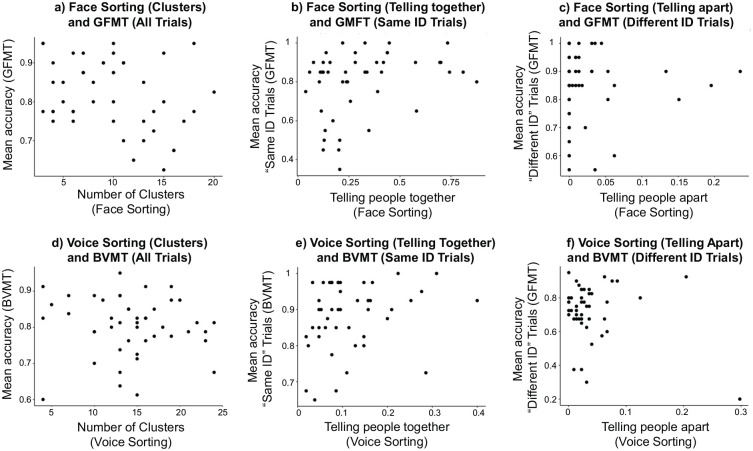
Figure 3.
Scatterplots showing the measures from the sorting tasks against the measures from the modality-matched discrimination tasks.
Panels a-c show scatterplots for face sorting and GFMT performance for all trials (Panel a), “same identity” trials (Panel b) and “different identity” trials (Panel c). Panels d-f show scatterplot for the voice sorting and BVMT accuracy, again for for all trials (Panel d), “same identity” trials (Panel e) and “different identity” trials (Panel f).

