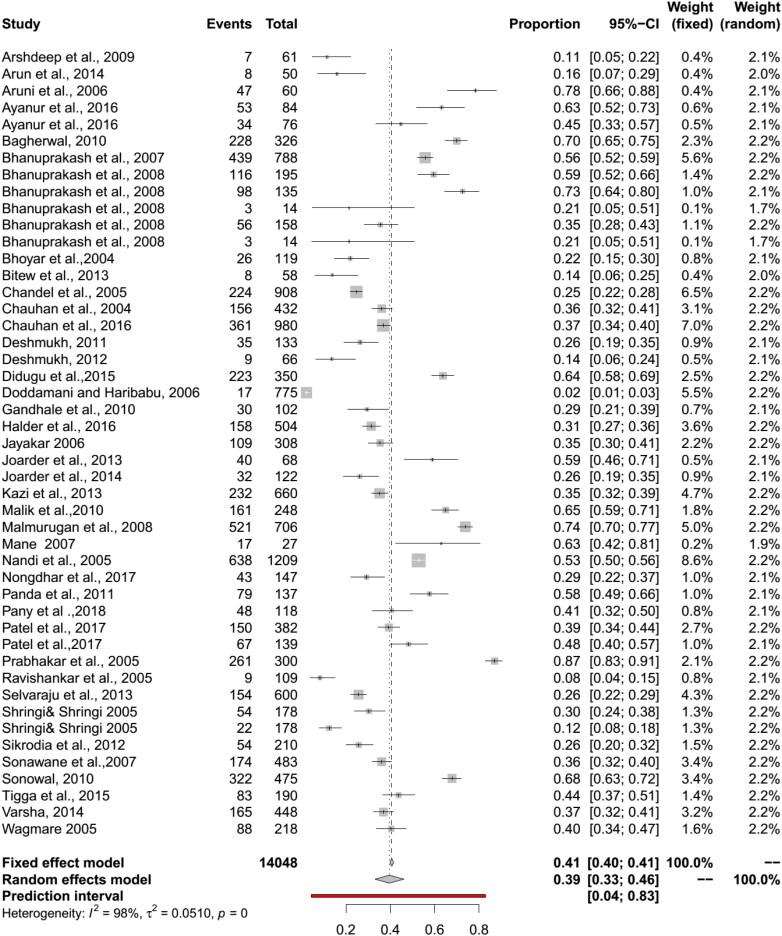
Figure 3.
Forest plot visualizing the BT seroprevalence in sheep reported for each included publication in the meta-analysis. Weightage given to each included publication by both RE and FE models have been shown for comparison. ‘Total’ refers to the number of animals in each publication, ‘Events’ refers to the number of BT seropositive animals and ‘Proportion’ refers the BT seroprevalence for each publication.

