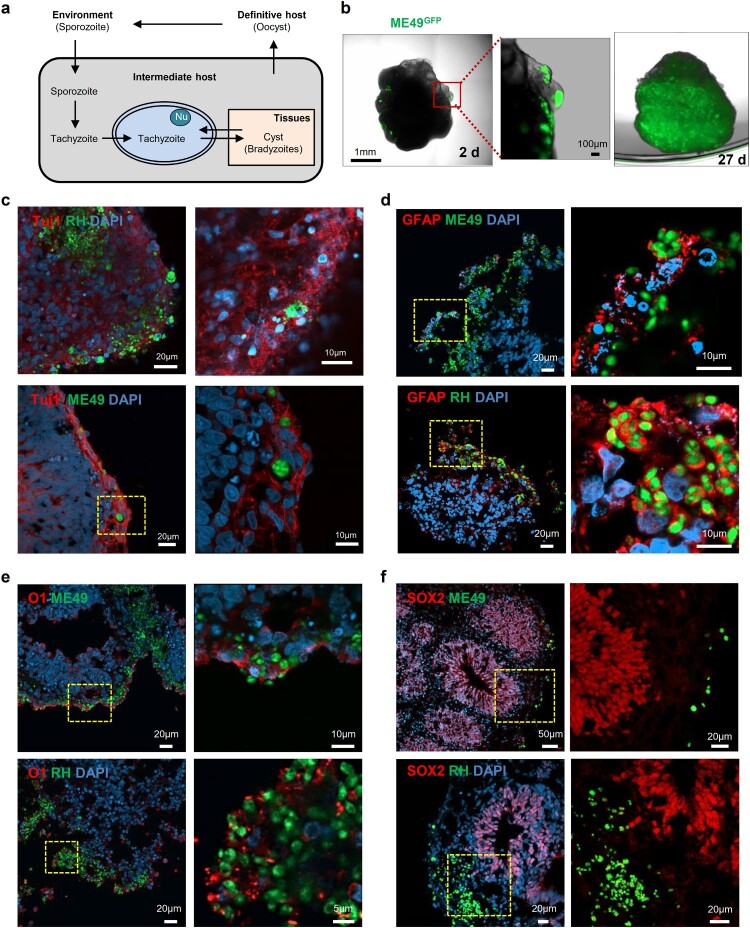
Figure 2.
Distribution of Toxoplasma gondii in the human cerebral organoids. (A) Schematic representation of the life cycle of T. gondii. (B) 3D images of a cerebral organoid infected with T. gondii (green). (C – F) Representative fluorescence images of cerebral organoids infected with 2 strains of T. gondii: ME49 (top) and RH (bottom) infected cerebral organoids are shown stained for (C) TUJ1, a neuronal marker; (D) GFAP, an astrocyte marker; (E) O1, an oligodendrocyte marker; and (F) SOX2, a radial glial cell marker. Scale bars, as indicated.

