Figure 5.
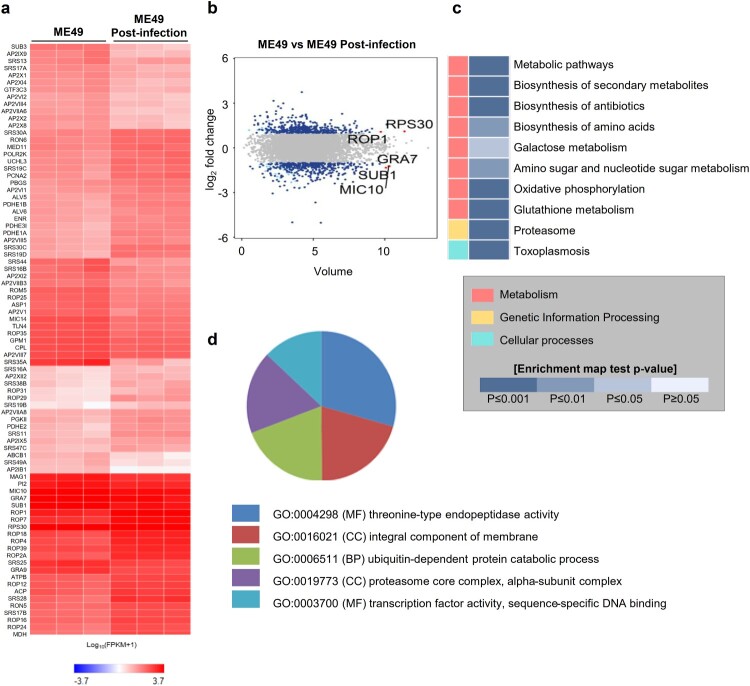
Transcriptome analysis of ME49 post-infection. (A) Differentially expressed genes of ME49 post-infection. Noninfectious ME49 was used as a control (|fc| ≥ 2, raw p-value < 0.05). A heat map was generated using Cluster grammer (http://amp.pharm.mssm.edu/clustergrammer/). (B) Volume plot showing differential expression of ME49 genes between 0 and 72 h post-infection (|fc| ≥ 2, raw p-value < 0.05). The top 5 gene names are indicated. (C) KEGG pathway analysis was performed using the differentially expressed genes (DEGs) of ME49 (|fc| ≥ 2, raw p-value < 0.05). (D) Gene Ontology (GO) annotation of T. gondii postinfection of cerebral organoids; p-value < 0.01. MF, molecular function; BP, biological process; and CC, cellular component.

